Thursday, January 31, 2008

Right Forecast - Wrong Reason


Newsweek blogger Sharon Begley has posted a mid-season review of Dr. Judah Cohen/s (AER...Inc.) long-range '07 / '08 winter forecast.

Cohen/s "...forecast calls for a cold start to December in the East and a mild early January, followed by a possible return to the deep freeze around Martin Luther King's birthday" (emphasis added).

He attributes these events to "...extensive snow cover in Siberia (which) sets in motion a train of meteorological events, with energy waves propagating to the stratosphere, where they weaken the vortex of winds over the North Pole."

Begley gives Cohen/s forecast high marks. "Don’t say we didn’t warn you. Anyone, especially in the northeast and Midwest, who is surprised by the arctic express that moved in over the weekend and is still gripping most of us today wasn’t paying attention last month.."

Cohen thinks he done good..too. "To predict swings in the weather almost to the day two months in advance should be impossible based on accepted climate theory," he said.

There/s room to argue whether these events have unfolded as forecast; however...the room b/comes quite small about whether Cohen/s physical reasoning was correct. Weakening the "vortex of winds over the North Pole" is a clear reference to the Arctic Oscillation going negative...which as a driver for the cold wx regime in the East...has clearly not been the case.

Right forecast - wrong reason.

State of the Cryosphere


Hard to tell...what with all the warm air afoot along the East Coast in recent days...but the NHEMI cryosphere continues to run a surplus.


In fact...NHEMI is enjoying its best boreal snow cover over the past ten years.


Graphics courtesy Bob Hart @ FSU

Tuesday, January 29, 2008

Contest # 6?


Today/s 12z GooFuS presents a potentially 'contest-worthy' snowstorm for FRI. The forecast storm track and frozen precipitation signature have a look similar to the snowstorms of DEC.

Biggest concern ATTM is the depiction of vigorous lo-lvl WAA which could push the 0°C isotherm north of too many stations.

Wednesday, January 23, 2008

Baby...It/s Warm Outside


Typically the coldest part of winter...January/s temperature departures are running a surplus.

Time to sell.

Coming Attractions


Various analyses and LR forecasts for early FEB abound the Internets. Most have a decidedly warm flavor yet today/s 12z GooFuS may be the first indication those outlooks wil turn on their collective heads.

LR progs over the past several days have shown a triad of low latitude storms rising from the Gulf 'o Mexico with plus-size warm sectors full of moist air assaulting the Northeast and mid-Atlantic regions. The storm tracks offered little hope for 'contest-worthy' snows over the forecast area through the end of Week2.

Not to put to fine a point on any numerical forecast past D+3...but today/s D+10 and beyond progs showed a notable shift from the previous storm tracks during the same time. Storms have taken on an ENE trajectory with arctic air positioned to their north instead of a rapid increase in latitude toward the NNE coming out of the GOM.

One model run does not a trend make. No way to tell whether this change is a one hit wonder or is the beginning of real shift in the forecast.

Friday, January 18, 2008

Contest # 6 - CANCELLED


Last night/s progs leaned the wrong way and continued to do so with today/s 12z runs.

Too few stations will be affected and with nuisance amounts expected decided to cancel Contest #6.

Thursday, January 17, 2008

Ignore-o-sphere Warming


Important signs point toward a sudden warming of the ignore-o-sphere in the coming weeks.

Wind reversal over the Pole...


Temperature reversal...


Warming of constant pressure surfaces from ~100 mb and up occur with a lowering of geo-potential heights. This phenomenon oft times leads to a dramatically colder troposphere...and eventually...a strongly negative AO. Not an unexpected event given the state of this winter/s QBO...which is depicted in the zonal wind chart above as the negative values (i.e., east wind) between 30 and 50 mb over the Equator.

In general...it takes about three weeks for the strat/s warming to work its way down to the near-sfc...all of which suggests a weak...unstable polar vortex...very cold temperatures...and storminess come early FEB.

Jim Hughes...posting @ StormVista...has be tracking the development of this impending event for several weeks and appears to have made a skillful LR forecast for it back in DEC.

Who Knew?

More than a nuisance snowfall over portions of the mid-Atlantic region today as a weak Miller-B 'snowstorm' interacted with a weak arctic wedge lodged against the Appalachians when it climbed out of the GOM/s loins and laid a swath of heavy...wet snow from northern GA to northern NJ.

Click Image to Animate


A few notable totals in the forecast area...
WFO LWX: 5.3"
DT-land: ~4.5"
CHO: 4.3"
IAD: 4"
BWI: 2.3"
ABE: 2.1"
DCA: 1.3"
PHL: 1"
WFO PHL: 1"
PTB: 0.5"

Contest # 6 - Call for Forecasts

So as not to miss out on what could turn out to be a good coastal snow storm...going with the aggressive 12Z GFS / NAM progs for SAT/s event. If subsequent SR runs hew toward the ECMWF 'out-to-sea' scenario...Contest #6 will be cancelled before FRI/s deadline.

Deadline: 10:30 PM EST FRI…18 JAN 2008
Forecast verification begins: 12:01 AM EST SAT…19 JAN 2008

Enter your forecast via the Contest/s web site
Follow the link to 'Enter Storm Forecast.'

Please enter 0.05 for trace amounts instead of a 'T.'

The Contest Administrator will post all forecasts to the NE_Wx Google Group within 30 minutes after the deadline and to the Contest web site the following day.

Contest subject to cancellation before the deadline…if forecast conditions warrant.

<.boiler plate>
Forecasters need to register once before entering…even if they were registered last year.

Registration is simple…requiring only a username and password. If you provide a valid e-mail address…a copy of your forecast will be sent to you. Please ensure your browser is enabled to accept first-party cookies.

Each contest must have a minimum of seven (7) forecasters for the results to be included in the end-of-season standings.

The NE.Wx Snowfall Forecast Contest (NEWxSFC) is a multi-month event that continues into late March or early April. In general…contests are held whenever a decent…synoptic-scale storm rears its head and threatens at least a half-dozen forecast stations with more than nuisance snowfall amounts. Forecasters are called to post their 'storm total' snowfall predictions…on deadline…for 27 NWS / FAA observing stations scattered about New England and the Mid-Atlantic regions. The Contest Administrator determines the deadlines for entries…verifies all forecasts…and publishes the final results to the Contest/s web site.

Please be sure to read the rules before entering the contest b/c your entry constitutes agreement to abide by them.

You can find the Contest Rules and additional information about error scoring…current monthly snowfall climatology from NCDC…daily CPC teleconnection indices…daily NESDIS N-Hemi snow cover…and NWS Daily Climate Bulletins (CDUS41) by pointing your browser here.
<./ boiler plate >

Interim Standings


There have been five Contests to date. Under the ‘two-thirds’ rule…forecasters who have entered at least four forecasts are included in this interim summary.

Click to enlarge

Donsutherland1 re-claims 1st place after five snowstorms with a 'best 4 out of 5' average SUMSQ Z-Score of -1.134.
Shanabe (-0.982) dropped one click to second.
TQ (-0.589) holds on to 3rd place.
Raven (-0.514) on the strength of winning Contest # 5...jumped from sixth to fourth.

Data table @ the Contest web site.

The forecasters listed below have issued three forecasts to date. They will be included in the next interim summary if they enter a forecast for Contest #6.
bruced39
dmcguriman
ilibov
Mitchel Volk
pjc368
SUMSQ errors for each contest snow storm are normalized with a 'Z-score'...then averaged to compute the standings. Forecasters who have entered at least 2/3 of all snow storm contests are included in the standings.

If a forecaster has participated in more than two-thirds of all snow storm contests...then Z-scores from their 'best two-thirds' forecasts are used to calculate interim and final standings. Same idea as dropping the lowest quiz score before the final grade is computed.

Wednesday, January 16, 2008

Contest # 5 - Final Results


Last year/s top 'season-total' forecaster Raven won Contest # 5 and hit the trifecta placing first not only for SUMSQ error...but for Total Absolute Error and Average Absolute Error...as well.

His forecast has the lowest absolute errors @ CAR...BDR...and DCA.

Congratulations...Raven!

Full forecast verifications and contest summary @ the web site.

Tuesday, January 15, 2008

Contest # 5 - Verification


Preliminary storm-total snowfalls from CDUS41 and CF6 bulletins for Sunday and Monday.

No suspect reports.

New daily records
BGR: 12.3" (11.4"; 1978)
PWM: 10.5" (9"; 1982)
ORH: 6.2" (6"; 1910)
BDL: 6.3" (6.1" 1910)
Final results and storm summary on Wednesday.

Contest # 5 - Teleconnections


Unremarkable teleconnection indices for this event...altho +PNA and -AO are always good to have.

Sunday, January 13, 2008

Contest # 5 - The Forecasts

Forecasts for Contest #5 have been posted on the web site

Forecasters: 17
Rookies: 5 (3...1st-timers)
Vets: 12

Storm-total Precipitation (STP)
MIN: 36.1" (Donald Rosenfeld)
MAX: 147.1" (pjc368)
AVG: 99.1"
Median: 101"

Saturday, January 12, 2008

Contest # 5 - Call for Forecasts


Classic Miller-B (pdf) storm expected to affect the forecast area late Sunday night and throughout the day on Monday.

Deadline: 9:00 PM EST Sunday…13 January 2008
Forecast verification begins: 9:00 PM EST Sunday…13 January 2008
Forecast verification ends: 11:59 PM EST Monday…14 January 2008

Enter your forecast via the Contest/s web site
Follow the link to 'Enter Storm Forecast.'

Please enter 0.05 for trace amounts instead of a 'T.'

All forecasts will be posted to the NE_Wx Google Group by the Contest Administrator before 10 PM EST Sunday…13 January 2008 and to the Contest web site by Monday evening.

Contest subject to cancellation before the deadline…if forecast conditions warrant.

<.boiler plate>
Forecasters need to register once before entering…even if they were registered last year.

Registration is simple…requiring only a username and password. If you provide a valid e-mail address…a copy of your forecast will be sent to you. Please ensure your browser is enabled to accept first-party cookies.

Each contest must have a minimum of seven (7) forecasters for the results to be included in the end-of-season standings.

The NE.Wx Snowfall Forecast Contest (NEWxSFC) is a multi-month event that continues into late March or early April. In general…contests are held whenever a decent…synoptic-scale storm rears its head and threatens at least a half-dozen forecast stations with more than nuisance snowfall amounts. Forecasters are called to post their 'storm total' snowfall predictions…on deadline…for 27 NWS / FAA observing stations scattered about New England and the Mid-Atlantic regions. The Contest Administrator determines the deadlines for entries…verifies all forecasts…and publishes the final results to the Contest/s web site.

Please be sure to read the rules before entering the contest b/c your entry constitutes agreement to abide by them.

You can find the Contest Rules and additional information about error scoring…current monthly snowfall climatology from NCDC…daily CPC teleconnection indices…daily NESDIS N-Hemi snow cover…and NWS Daily Climate Bulletins (CDUS41) by pointing your browser here.
<./ boiler plate >

Friday, January 11, 2008

Going Negative - How Much for Dulles?


For lesser daily snowfalls and snowfalls of 12" or more...there/s a higher chance of occurrence with +PNA...+NAO...and -AO. -NAO is preferred for 7 - < 12" amounts.


With +PNA...+NAO is more likely for daily snowfall below 7".


With +NAO...-AO is more likely for lesser daily snowfalls and daily snowfalls of 12" or more.

Dulles is a short distance WNW of DCA…yet IAD/s snowfall climatology is 35% greater than DCA. Each station/s micro-climate and elevation may be why more snow is observed at IAD (307” MSL) than DCA (59’ MSL).

Neither location will ever be considered a snow capital but there are interesting differences between them for the preferred sign of NAO.

For the Big 3…
For daily snowfalls up to 5” and +12” amounts…
IAD prefers +PNA…+NAO…-AO
DCA prefers +PNA…-NAO…-AO

For 5 < 7”…
IAD: +PNA…+NAO…+AO
DCA: +PNA…+NAO…-AO

For 7 - < 12”…
IAD: +PNA…-NAO…-AO
DCA: +PNA…+NAO…-AO

+PNA and -AO are common contributing factors @ both stations except for 5 - < 7” amounts. The sign of NAO flip flops taking the opposite sign between daily snowfall categories and stations.

The more stations examined...the -NAO CW b/comes more and more questionable.

Thursday, January 10, 2008

It/s Miller Time!


The 12z GooFuS dangled a bright...shiney object in front of a lot of eyeballs on the EC today with it/s medium range forecast for a Miller-A event early next week.

Here/s what the short wave/s blastocyst looked like this afternoon...way out over the PAC...


No surprise the progs didn/t show any reflection of the feature belo 5H since it/s floating over the axis of a flat ridge. At this point...it/s all upper level NRG...the so-called 'upper level disturbance.' After it comes ashore and crosses the Rockies...column stretching would deepen the circulation with cyclogenesis in the NW GOM.

Partly Cloudy...Partly Sunny...Mostly Stoopit


What part of the word 'partly' is so hard to understand?

The National Weather Circus sez 'partly cloudy' and 'partly sunny' are the same animal. Opaque clouds covering 3/10 - 6/10 of the sky. 'Sunny' is used during the day and 'cloudy' is used at night. Vanilla is as vanilla does.

Other meteorologists say "partly sunny means a mixture of sun and clouds is expected, but more sun than clouds. Partly cloudy also means a mixture of sun and clouds is expected, but more clouds than sun."

'Partly sunny' or 'partly cloudy' is "...a mixture of clouds and sun." OK. No problem with that part.

Now consider the following...
The forecast can call for a 'sunny'...'mostly sunny'...or 'partly sunny' sky. If 'partly sunny' means 'more sun than clouds'...does that mean ‘partly sunny’ is sunnier than ‘mostly sunny?

Or how about this...
The forecast can call for a 'cloudy'...'mostly cloudy'...or 'partly cloudy' sky. If 'partly cloudy' means 'more clouds than sun'...does that mean ‘partly cloudy’ is cloudier than ‘mostly cloudy?’

What stoopit comes up with this 'partly sunny is the same as partly cloudy' and 'partly is more than mostly' stuff...anyway?

Going Negative - How Much for DC?

Where the CW about the -NAO/s 'critical' importance to mid-Atlantic snowfall comes from is hard to tell…since more and more it appears to be something of a pleasing urban legend bordering on pure myth.

Just last week…the CW was held out again as gospel for getting snow in the DC area in this blog entry from The Washington Post/s “Capitol Weather Gang.”

“Some other ingredients, but not all, that make up the classic snow pattern for the region include the North Atlantic Oscillation (NAO), the 50-50 low, and the Polar Vortex.

While you don't need every ingredient in place to get snow here, the more you have in place the better. Let's start with the NAO. The NAO is traditionally measured by the difference in pressure between Iceland and the Azores. When this index is negative, it is often indicated by a block of high pressure over Greenland. When this block is strong and well-placed, it tends to lock the cold air in place over the East Coast, which is critical for snow in our region.”
Never mind how it parrots uncritically the CW about the ‘critical’ need for -NAO while ignoring how important the ‘positive PNA’ long wave flow regime is to producing more than nuisance snows for DC or how the ingredients described are all part of the same phenomenon or missing the mark by attributing the source of snow-enabling cold air along the EC to the Newfoundland LOW.

So...how well does the CW hold up for DC...located in the heart of the mid-Atlantic and close enough to the coast to see more than its share of cold rain in winter? Is a -NAO critical for good snows in the nation/s capital?

PNA…NAO…AO


CW for ‘any amount’ strongly influenced large number of snowfalls (292 days) less than 5” and for historic amounts of 12” or more. The probability for +NAO is higher once daily snowfall reaches 5 - 12” range.
PNA…NAO


CW for ‘any amount’ strongly influenced large number of snowfalls (292 days) less than 5” and for historic amounts of 12” or more. The probability for +NAO is higher once daily snowfall reaches 5 - 12” range.
PNA…AO
CW for ‘any amount’ strongly influenced large number of snowfalls (292 days) less than 5” and above 7” (27 days). The probability for PNA of either sign and -AO is highest when daily snowfall occurs in the 5 - < 7” range.
NAO…AO


+NAO and -AO are more likely for daily snowfalls from 5 - less than 12”.
Bottom line

'Big 3’
12HR warning snows (5" - < 7”) indicated by PNA of either sign...+NAO...-AO
24HR warning snows (+7") indicated by +PNA...+NAO...-AO
DCA/s best 24 hour snows (+12") indicated by +PNA...-NAO...-AO supports CW

The CW is supported for the ‘Big 3’ teleconnection indices when DCA/s daily snowfall is 12” or more.
Ignoring NAO…
12HR warning snows (5" - < 7”) indicated by +PNA...-AO supports CW
24HR warning snows (+7") indicated by +PNA…-AO supports CW
DCA/s best snows (+12") indicated by +PNA...-AO supports CW

The CW for +PNA and -AO is supported for both warning thresholds…all divisions of daily snowfall…and for historic daily snowfalls. The CW is not hard and fast for DCA/s 12HR warning criteria as the 5 - < 7” amount with +PNA and -AO occurs with an equal probability as -PNA and -AO.
Ignoring AO…
12HR warning snows (5" - < 7”) indicated by PNA or either sign...+NAO
24HR warning snows (+7") indicated by +PNA…+NAO
DCA/s best snows (+12") indicated by +PNA...-NAO supports CW

CW for +PNA and -NAO is unsupported for 12- and 24HR NWS warning criteria when daily snowfall is 5 - < 12”.

CW for +PNA and -NAO is supported for daily snowfalls < 5” and historic (+12”) daily snowfalls.
Ignoring PNA…
12HR warning snows (5" - < 7”) indicated by -NAO...-AO supports CW
24HR warning snows (+7") indicated by +NAO…-AO
DCA/s best snows (+12") indicated by -NAO...-AO supports CW

CW for -NAO and -AO is supported for 12HR warning criteria and historic (+12”) daily snowfalls.

CW for -NAO and -AO is unsupported for 24HR warning criteria and for 7 - < 12” daily snowfalls.
----------
The NAO CW is valid for nuisance snows and rare events that produce historic amounts. It cannot; however...be applied without regard to the sign of PNA for daily amounts that trigger warnings. +PNA and / or -AO are far more reliable indicators of favorable conditions for snow in DC.

Tuesday, January 8, 2008

Going Negative - How Much for Philly?

The oft-repeated conventional wisdom concerning EC snow storms...especially in the mid-Atlantic region...holds there/s a requirement for the 'Big 3' teleconnection indices (PNA...NAO...and AO) to be on the 'right' side of zero. Most common is the idea unless and until the NAO goes negative...good snows just...don/t...won/t...ain/t gonna happen.

There may actually be some physical reasoning involved in reaching this conclusion about the 'Big 3' b/c 1) -NAO events are marked by arctic air masses flooding the eastern CONUS. The resultant baroclinic zones are strong and ripe for the development of ageostrophic...thermally-direct...vertical motion fields and cyclogenesis; 2) +PNA results from 'high' amplitude - shortened wavelength westerlies across the CONUS where Miller A-type cyclogenesis (.pdf) occurs preferentially over the northern waters of the GOM or over the Gulf Stream off the SE coast; and 3) -AO is observed when the polar vortex is 'weak,' which allows arctic air masses to drain into lower latitudes where it can excite strong winter storms.

But how important is it to have the 'correct' index sign to get a decent EC snow storm? Is the CW correct?

In an expanded follow-up to last season/s 'Going Negative' series...analyses of historical daily snowfall data and the 'Big 3' 
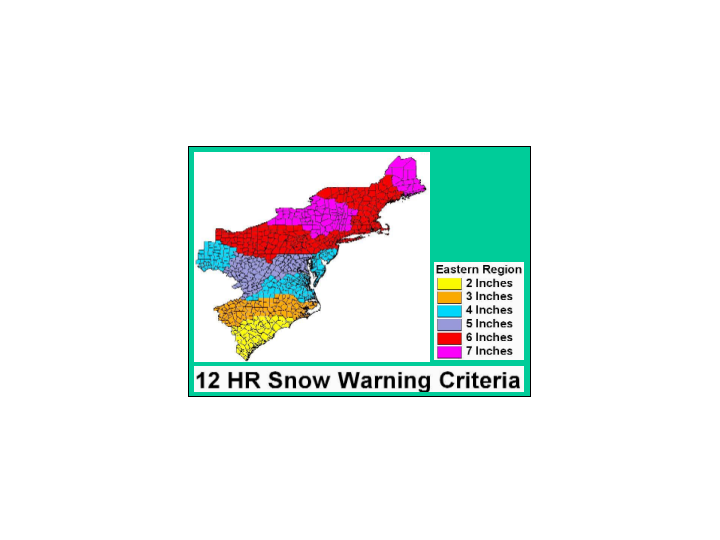
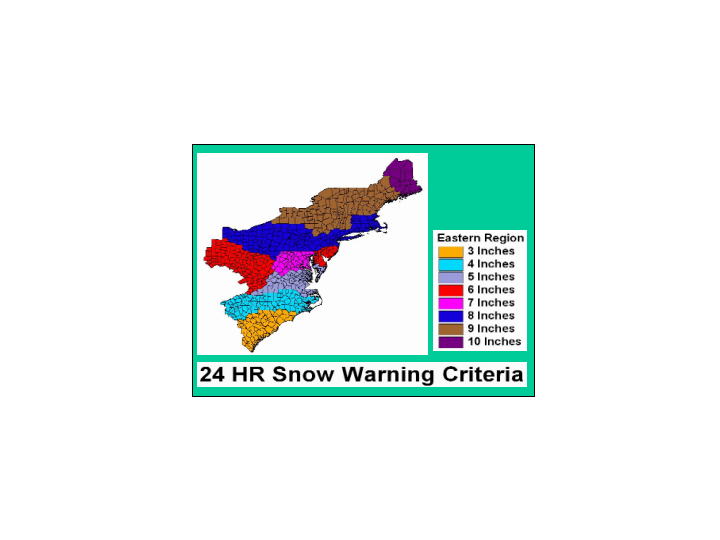
teleconnection indices from 1950 to 2007 for M-A stations seeks to answer that question. The CW is tested for PHL by evaluating joint probabilities its station snowfall relative to NWS Eastern Region/s 12- and 24-hour snowfall warning thresholds and the 'Big 3' teleconnection indices.

First up: Philly!

PNA...NAO...AO


Any amount: +PNA...+NAO...-AO
1 - < 4”: +PNA...+NAO...-AO
4 - < 6”: +PNA...+NAO...AO of either sign
+6”: +PNA...-NAO...-AO supports CW
6 - < 9”: PNA of either sign...-NAO...-AO
9 - < 12”: +PNA...NAO of either sign...AO of either sign
+12”: +PNA...+NAO...AO of either sign
CW strongly influenced by 6 - < 9” snowfalls. All combinations of NAO and AO with +PNA have equal chances for 9 - < 12+ events. +PNA and +NAO preferred for storms producing more than 12” in 24 hours.

PNA…NAO


Any amount: +PNA...+NAO
1 - < 4”: +PNA..+NAO
4 - < 6”: +PNA...+NAO
+6”: +PNA...-NAO supports CW
6 - < 9”: PNA or either sign...-NAO
9 - < 12”: +PNA...NAO of either sign
+12”: +PNA...+NAO
CW strongly influenced by +PNA for +9” snowfalls and -NAO for 6 - < 9” snowfalls. +PNA and NAO of either sign have equal chances for 9 - < 12 events. +PNA and +NAO preferred for storms producing more than 12” in 24 hours.
----------
PNA…AO
Any amount: +PNA...-AO
1 - < 4”: +PNA...-AO
4 - < 6”: +PNA...AO of either sign
+6”: +PNA...-AO supports CW
6 - < 9”: PNA or either sign...-AO
9 - < 12”: +PNA...AO of either sign
+12”: +PNA...AO of either sign
CW strongly influenced by +PNA for +9” snowfalls and -AO for 6 - < 9” snowfalls. +PNA and AO of either sign have equal chances for +9”.

NAO…AO


Any amount: +NAO...-AO
1 - < 4”: +NAO...-AO
4 - < 6”: +NAO...AO of either sign
+6”: -NAO...-AO supports CW
6 - < 9”: -NAO...-AO supports CW
9 - < 12”: NAO of either sign...AO of either sign
+12”: +NAO...AO of either sign
Bottom line:
12HR warning snows (+4", < 6”): +PNA...+NAO...AO of either sign
24HR warning snows (+6"): supports CW (+PNA...-NAO...-AO)
PHL/s best 24 hour snows (+12"): +PNA...+NAO...and AO of either sign

Ignoring NAO...
12HR warning snows (+4", < 6”): +PNA...AO or either sign
24HR warning snows (+6"): supports CW (+PNA...-AO)
PHL/s best snows (+12"): +PNA...AO of either sign

Ignoring AO...
12HR warning snows (+4", < 6”): +PNA...+NAO
24HR warning snows (+6"): supports CW (+PNA...-NAO)
PHL/s best snows (+12"): +PNA...+NAO

Ignoring PNA.
12HR warning snows (+4", < 6”): +NAO...-AO
24HR warning snows (+6"): supports CW (-NAO...-AO)
PHL/s best snows (+12"): +NAO...-AO

Can the CW for PHL stand the light of data?

Yes...it can for the general case of 24-hour snowfalls of 6" or more; however...decent snows of at least 4" and less than 6" (12HR ERH Warning threshold) occur with a preference for +NAO and no preference for sign of AO...as do historic events of 12" or more. +PNA plays a greater role than a -NAO or -AO for PHL/s snowfall in any amount.

The biggest surprise was found in the 9 - < 12" category where equal probabilities exist for PNA of either sign.

Monday, January 7, 2008

Going Negative - Another Look


Last season/s five-part series 'Going Negative' took a look at the conventional wisdom (CW)...from the perspective of NEWxSFC snow storms...about the 'need' for the NAO to be negative or the PNA to be positive or both to get good snows in the Northeast and mid-Atlantic. The main conclusions were 1) there was no preference in sign for PNA...2) AO was generally negative...and 3) contest snow storms were more likely when the NAO was positive. The data set was limited by the number of years the contests have been held and the number of storms where PNA...NAO...and AO data were readily available.

The question has come up again recently...as it does in one form or another every year...about the teleconnection CW. Near-record and / or well-above period-of-record normal (PORN) snows were observed in the Northeast last month during 'unfavorable' conditions (-PNA...+NAO)...which suggests that region/s snows are not dependent on the CW.

So..if the CW does not apply to the Northeast...then does it apply to the mid-Atlantic or is it more a myth?

The Synoptiscope® has been in VCP 31 since JAN 02 and indications are it will stay that way for @ least another week. We/ll take another...broader look at the 'Big 3' teleconnection indices while we wait for the next snow storm to see if the CW can stand the light of data in the mid-Atlantic.

Daily snow fall data (1950 - 2007) from U of Utah and daily normalized indices for PNA...NAO...and AO will be analyzed to find the probabilities for +4" and 12/24hr warning criteria events for several contest stations in the M-A. UofU data has missing values for portions of '96 and '97...which is unfortunate b/c of the bonus snows observed in JAN '96...but it/s the best available free data.

First up: Philly!

Friday, January 4, 2008

Interim Standings

Click to enlarge

Shanabe takes possession of 1st place after four snowstorms with a best '3 out of 4' average SUMSQ Z-Score of -1.225...having moved up from 4th place in the previous interim standings. He was propelled into the lead by his run-away 1st place finish in Contest #4.

Donsutherland1 (-1.182) and TQ (-0.589) drop one click to second and third place...respectively.

Herb @MAWS (-0.443) holds on to 4th place. Donald Rosenfeld (-0.430) made the largest move by advancing from 9th to 5th.

SUMSQ errors are normalized with a 'Z-score' for each contest snow storm...then averaged to compute the standings. Forecasters who have entered at least 2/3 of all snow storm contests are included in the standings.

If a forecaster has participated in more than two-thirds of all snow storm contests...then Z-scores from their 'best two-thirds' forecasts are used to calculate interim and final standings. Same idea as dropping the lowest quiz score before computing the final grade.

Thursday, January 3, 2008

Contest # 4 - Final Results

NEWxSFC/s perennial bridesmaid Shanabe (aka SYRMAX) finally made it to the alter of Contest #4 and crushed the field in doing so by verifying with a SUMSQ error score 47% better than the average error. His winning forecast accounted for 95% of the observed snowfall/s variability.

Shanabe hit the trifecta finishing first in Total Absolute Error (11.6") and Average Absolute Error (0.48"). His STP forecast error of 8.26" was good for second place.

Congratulations...Shanabe!

Full forecast verifications and contest summary @ the web site.

Contest # 4 - Teleconnections

Sharp drop in AO ahead of the storm associated with big push of arctic air into CONUS/ eastern half. PNA swung the distance of one STD from negative to positive along with a near-normal NAO moving into higher territory.

Favorable PNA and AO conditions produced MAX snowfall @ contest stations that were the lowest of the four snow storms to date.

Contest # 4 - Verification

Preliminary storm-total snowfalls from CDUS41 and CF6 bulletins for Tuesday and Wednesday.

BGR amount is suspect given PNS reports of 9 - 10" SE of the station on the coast and 10 - 12" 7 - 10 miles to the N.

New daily records
None


Final results and storm summary on Friday.
Please report errors in 'Remarks.'

Wednesday, January 2, 2008

Interim Standings

After three snow storms...donsutherland1 is in 1st Place with a hefty lead.

Click to enlarge

SUMSQ errors are normalized with a 'Z-score' for each snow storm contest...then averaged to compute the standings. Forecasters who have entered at least 2/3 of all snow storm contests are included in the standings.

If a forecaster has participated in more than two-thirds of all snow storm contests...then Z-scores from their 'best two-thirds' forecasts are used to calculate interim and final standings. Same idea as dropping the lowest quiz score before computing the final grade.

Contest # 3 - Final Results

Chief Forecaster Donsutherland1 finished in 1st place for contest snow storm #3. This is his second 1st place finish this year.

No only did he have the lowest SUMSQ error...he hit the trifecta with top honors for Total Absolute Error (30% improvement over Consensus) and Average Absolute Error (1.16").

Donsutherland1/s STP forecast for 60" had an error of 0.95" (total observed snowfall @ all stations less total forecast snowfall @ all stations). The R-square statistic of 0.837 shows his forecast accounted for 84% of the observed snowfall/s variability.

Congratulations...Don!

Full forecast verification and contest summary @ the web site.

Tuesday, January 1, 2008

Mild...Then Wild


Despite some disagreement among the ENSM members...teleconnection indice forecasts suggest movement toward a colder...stormier planetary flow regime for the EC around mid-JAN following a brief spell of mild wx.


Today/s GooFuS depicts a series of SE PAC cyclones coming ashore then migrating NE through the central CONUS...blocked from coming too far E by the stubborn SE heat ridge through D+8. The extended range progs create a hi-amplitude ridge W that allows intense arctic anticyclones back into the Lower 48.


When the cold returns...so do the EC storms.

Snowfall Summary - DEC '07

Bonus snows were observed over much of the Northeast in December...with some stations getting up to three and half times their period-of-record normal (PORN) amounts.

BOS snowfall of 27.7" was 360% PORN (7.7") and amounts to 68% of D-J-F-M PORN (41").
CON snowfall of 44.5" is 78% of their D-J-F-M PORN (57.3"). DEC normally contributes 24% of the CON/s season-total snowfall and 19% @ BOS.

Most stations...where DEC snowfall was well in excess of PORN...also observed below normal temperatures. BGR had the greatest departure of -4°F. The exception was ACY where DEC/s snowfall of 4.4" was 183% of PORN and temperatures were 1.7°F above normal.

RED ==> Top 25%
BLUE ==> Bottom 25%
White ==> everywhere in between

Contest # 3 - Verification

Preliminary storm-total snowfalls from CDUS41 and CF6 bulletins for Sunday and Monday.

SN-to-H2O ratio for MDT is estimated.

Minor discrepancy between amounts reported by 12/30 CDUS41 (0.9") and F6 (0.3") @ PWM.

CAR amount is suspect given its 10:1 ratio and the vertical temperature profile during the event; however..VCNTY PNS reports suggest 3.4" is likely correct.

New daily records
12/31
BGR - 8.2" (6.4"; 1972)
CON - 10.1" (6"; 1879)
PWM - 6.6" (4.3"; 1893)
ALB - 7.9" (6.4"; ?)

Final results and storm summary on Wednesday.
Please report errors in 'Remarks.'