Winter '24 / '25 - Snow Storm #4: FINAL Results and Storm Summary
 |
| BOS - Morrissey Boulevard FEB-78 |
 SUMSQ: sum of square errors (")
SUMSQ Z: Z-score
STP: storm total precipitation error (")
TAE: total absolute error (")
AAE: average absolute error (")
(#): category rank
---
Forecast by Observed Snowfall Scatterplots for Top 4 Forecasts

- Forecast/s dotted BLUE line below (above) the Observed snowfall/s solid RED line ==> under (over) forecast error.
- R^2: how well the forecast 'explained' the variability of the observed snowfall (i.e., an R^2 of 0.710 means the forecast explained 71% of the observed snowfall's variability).
---
Comparison of Top 4 Forecasts and Observed Snowfall by Station

---
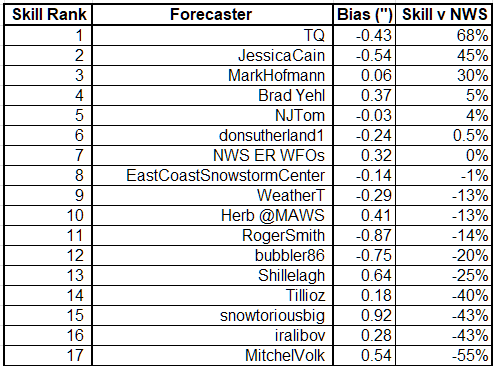
Forecast Skill Score (measured against NWS ER WFOs)

- Positive (negative) skill values indicate the degree of a forecast/s improvement (degradation)
compared to NWS forecasts.
- Bias: the arithmetic difference between the average Forecast snowfall and the average Observed snowfall (avgForecast - avgObserved).