Wednesday, January 05, 2011

Winter '10 / '11 - Stratospheric Warming - Take 3

Appears associated with the ECMWF's forecast for hi-latitude blocking over Siberia beginning 1/11/11.  Note the dramatic weakening of the stratosphere's polar vortex between the initial panel (west @60 m/s = ~120 kts) and its reversal on D+10 (east @15 m/s = ~30 kts).

Also depicted on D+10 zonal mean wind chart are deep layer easterlies throughout the troposphere suggesting a strongly negative AO.

Tuesday, January 04, 2011

Chat with Dr. Louie Uccellini - "NE Snowstorms" Co-Author

"...3:00 p.m. ET on Thursday Jan. 6 for a live online chat with winter weather expert Louis Uccellini, the director of the National Weather Service's National Center for Environmental Prediction (NCEP), to discuss the USA's winter weather."

More...

Monday, January 03, 2011

North Atlantic Oscillation - Trending South

Blue line is NAO's five-year moving average for meteorological winter (D-J-F) which at the end of last winter dipped below zero for the first time since 1982.

Note how the 5-yr moving average was negative for 21 years between 1953 and 1973...then a nine-year transition period when the sign flip-flopped after holding serve one way or the other briefly for four or five years...followed by 27 years where the NAO's moving average was positive.


Might this herald the start of a protracted...multi-decadal period of negative winter-time NAOs?


In other news...DEC-10 NAO came in at -1.85...marking the 15th consecutive month it's been below zero and the 3rd lowest index value for December since 1950.  Second-lowest December was 1963.  All-time record minimum is DEC-09.

Closest analog year based on least-squares analysis is 1968 / 1969 which was +ENSO...-QBO...and -PDO.

Second-closest analog year based on least-squares analysis is 1977 / 1978 which was +ENSO...+QBO (month-one of west phase)...and mixed PDO.

Winter '10 / '11 - Snow Storm #1 - Final Results - UPDATE

F6 bulletins (CXUS51 - PRELIMINARY LOCAL CLIMATOLOGICAL DATA) for several forecast stations now have data entries or have been revised.  Forecast verifications have been updated to reflect the new information.

Original / Revised Station Data
BGR - 10.3" / 10.8"
PWM - 8.5" / 7.5"
CON - 6.6" / 7.1"
ORH - 17" / 12.7"
ACY - 19" / 20"

No change in the standings for the top three forecasts; however...'ejbauers' and 'Shillelagh' swap 4th and 5th places...'TQ' and 'iralibov' move ahead to 6th and 7th as 'weatherfella' drops to 8th...and 'snowman' jumps over 'Newa' from 11th to 10th after updating the results with new or amended verification data.
---
Original Results
-1.277 1 Senior donsutherland1
-1.033 2 Senior Donald Rosenfeld
-0.929 3 Senior Mitchel Volk
-0.880 4 Intern ejbauers
-0.823 5 Senior Shillelagh
-0.509 6 Journeyman weathafella
-0.488 7 Senior TQ
-0.455 8 Chief iralibov
0.040 9 Journeyman WeatherT
0.179 10 Senior Newa
0.313 11 Senior snowman
0.922 12 Intern Roger Smith
1.331 13 Senior defman27
1.721 14 Journeyman MarkHofmann
1.889 15 Intern Weathermbug

---
Revised Results
-1.274 1 Senior donsutherland1
-1.013 2 Senior Donald Rosenfeld
-0.986 3 Senior Mitchel Volk
-0.868 4 Senior Shillelagh
-0.866 5 Intern ejbauers
-0.512 6 Senior TQ
-0.466 7 Chief iralibov
-0.393 8 Journeyman weathafella
-0.021 9 Journeyman WeatherT
0.246 10 Senior snowman
0.263 11 Senior Newa
1.061 12 Intern Roger Smith
1.233 13 Senior defman27
1.795 14 Journeyman MarkHofmann
1.802 15 Intern Weathermbug

---
The Forecast Verifcation page at the Contest web site will be updated but not the storm Summary page.
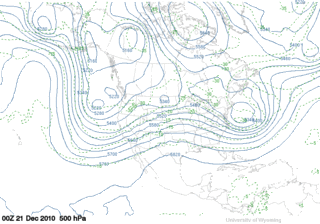
Friday, December 31, 2010

Winter '10 / '11 - Coastal Teaser #2

Look familiar?

GooFuS has a coastal storm on the 7th as well; however...its genesis is in the northern stream leaving the SW bowling ball behind.


Graphics courtesty Plymouth State Wx Center.

Wednesday, December 29, 2010

Winter '10 / '11 - Snow Storm #1 - Final Results

1st
Donsutherland1
SUMSQ: 385.44
SUMSQ Z: -1.277
STP: 3.45 (1)
TAE: 81.25 (1)
AAE: 3.01 (1)

2nd
Donald Rosenfeld
SUMSQ: 526.03
SUMSQ Z: -1.033
STP: 12.85 (4)
TAE: 95.85 (3)
AAE: 3.55 (3)

3rd
Mitchel Volk
SUMSQ: 585.48
SUMSQ Z: -0.929
STP: 20.65 (5)
TAE: 97.35 (4)
AAE: 3.61 (4)

Honorable mention
EJBauers
SUMSQ: 614.01
SUMSQ Z: -0.880
STP: 51.45 (8)
TAE: 104.25 (5)
AAE: 3.86 (5)

SUMSQ: sum of square errors
STP: storm total precipitation error
TAE: total absolute error
AAE: average absolute error
(number):  category ranking

Full forecast verification and summary at the Contest web site.

Winter '10 / '11 - Snow Storm #1 - Snow Cover

Image courtesy NASA's Terra satellite.

Close-up of the NE here

Winter '10 / '11 - Snow Storm #1 - Teleconnections


Arctic and North Atlantic Oscillations have been below zero...with few exceptions...since mid-NOV thanks to strong hi-latitude blocking over the North Atlantic and Pacific Oceans.

Likewise...the PNA.

Winter '10 / '11 - Snow Storm #1 - Storm Evolution at 500 MB


Short-wave trough comes ashore in southern CA on 23-DEC-10...undercuts the short-wave ridge axis over the Rockies on the 24th...then phases with a northern stream short-wave in over the lower MS River Valley.  Note the strong cold air advection (CAA) driving the northern stream short-wave at 00z on the 26th prior to the phasing which causes the wavelength to shorten and amplify.

The mid-level circulation begins to close off 12 hours later at 12z on the 26th followed by a 12-hour 180 m height-fall between 00z and 12z on the 27th.  Large height-falls at 500 MB indicate strong cooling aloft associated with strong upward vertical motion (UVM).

Stream-phasing was one element behind the flip-flopping of NWP solutions in the run-up to the snow storm.

Graphics courtesy University of Wyoming

Tuesday, December 28, 2010

Winter '10 / '11 - Snow Storm #1 - Preliminary Verification

Preliminary storm-total snowfalls for Sunday and Monday from CDUS41...CXUS51...and PNS.

No snowfall data in the NWS climate bulletins for SBY.  Verifying storm-total snowfall is the average of two vicinity station reports from AKQPNS.  This station's snowfall reporting fell into a black hole last year and has yet to reappear.

Storm-total snowfall for CON looks suspicious given its relatively low water equivalent; however...vicinity reports carried in BOXPNS suggest the amount is accurate.

Twelve new daily records.

SUN...26-DEC-10
ISP - 11.3" (1"; 2003)
JFK - 10.5" (4.4"; 1969)
ACY - 17.4" (0.2"; 1970)
ORF - 13.4" (5"; 2004)
RDU - 6.7" (T; 2004)

MON....27-DEC-10
CAR - 6.2" (5.4"; 2005)
BGR - 10.3" (4.1"; 1947)
BOS - 8.3" (5.7"; 1894)
BDR - 4" (1.1"; 1963)
BDL - 7" (4.7"; 1944)
JFK - 5.1" (3.2"; 1984)
EWR - 6.5" (4.7"; 1984)

Please report errors and a link to the correct data in Comments.

Final results and storm summary by WED evening.