Thursday, November 24, 2011

Winter '11 / '12 - Great Appalachian Storm of 1950


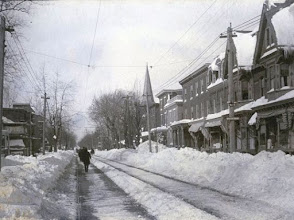
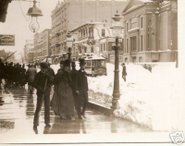
Kevin Myatt at the Roanoke Times reminds us of a blockbuster snow storm from a Thanksgiving weekend long ago. 

Known at the time as 'The Storm of the Century' ... Miller 'B' cyclogenesis occurred along shore of the Carolinas on the 24th ... rapidly deepened (26mb / 12hrs) over the Chesapeake Bay  / Delmarva on the 25th...then became trapped beneath a strong 1042 mb blocking HIGH to its north.

Kevin notes...

"The Great Appalachian Storm of 1950 left behind 9 inches of snow in Roanoke and 14inches in Wytheville, with 4 to 12 inches common across our region (ED:  SW VA).

"But it was far worse elsewhere. Parts of West Virginia, eastern Kentucky and western Pennsylvania saw 2 to 4 feet of snow. Winds topped 100mph in New York. The storm is blamed for more than 300 deaths and about 1million people cut off from electricity."
Some other interesting minutia about this historic early season snow storm...

Snowfall totals...
Youngstown...OH - 29"
Pittsburg...PA - 30"
Elkins...WV - 34"

Notable wind gusts were observed at...
Newark (EWR)...NJ - 108 mph
Bear Mountain (N of NYC) - 140 mph
Concord (CON)...NH - 110 mph
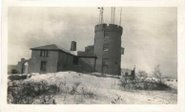
Mount Washington (MWN)...NH - 160 mph

Other storm effects...
- Coastal flooding breached dikes and flooded runways at LaGuardia Airport in New York.
- Crop damage and record minimum temperatures in the deep south (Birmingham:  5°F; Atlanta:  3°F;  Nashville:  -1°F)
- Some coastal areas in New England reported greater damage than the famed '38 hurricane.
- "...(T)he Ohio State-Michigan football game went on as scheduled (in Columbus), despite blizzard conditions. Nearly 50,000 fans showed up to watch the “Blizzard Bowl,” with a Rose Bowl berth the payoff. Michigan won the game 9–3 without making a single first down and only gaining 27 yards on offense." (Weatherwise Mar-Apr 2011)

Charts and graphs after the jump.

Tuesday, November 22, 2011

Winter '11 / '12 - The North Atlantic Oscillation and Sea Surface Temperatures

Conventional wisdom states it's next to impossible to skillfully forecast the state of the North Atlantic Oscillation (NAO) more than a week to ten days in advance.
Even that's a stretch given the generally low correlation between forecast and observed conditions.  The current ten-day and 14 day correlations are 0.72 and 0.55...respectively which means the forecast explains 52% and 30% of the NAO's variability.  There's some skill at ten-days...not so much at 14.

The UKMET Office produced an NAO winter-season forecast up until the fall of 2009.  It was based on sea surface temperature anomalies (SSTA) in the mid-Atlantic Ocean.  They claimed a 67% skill level.  It's no longer published...possibly b/c of recent controversies and adverse publicity surrounding their 'failure' to forecast the severity of the past two winters.

Image courtesy UKMET Office
"By taking the observed SST anomaly for May and calculating how it projects onto the predictor pattern we (ed:  UKMET Office) can make a prediction for the winter NAO.

"If the projection is positive (i.e., the anomaly pattern looks similar to the predictor pattern shown above) then the prediction is for a positive winter NAO.

"Conversely, if the observed May SST anomaly projects negatively onto the predictor pattern (i.e., it looks like the reverse of the predictor pattern) then we (ed:  UKMET Office) would predict a negative NAO."
---
So...where were SSTAs lurking in the Atlantic this May?
What...if anything...might they predict about the state of Winter '11 / '12 NAO?

If you're rooting for Team NAO to come through and deliver a halfway decent winter...then you can't be happy about the positive-negative-positive SSTA pattern along the northwest rim of the Atlantic Ocean last May.

The observed pattern predicts low 500mb heights will prevail over Greenland this winter and therefore...a predominantly positive NAO.
---
More about SSTAs and the NAO during winter in a few days.

Thursday, November 10, 2011

Winter '11 / '12 - Sunspots and The North Atlantic Oscillation

From 'Bits of Science'...

"Recent Nature Geoscience publication shows correlation between sunspot cycle and the AO and NAO index. This in turn influences northern hemisphere temperature distribution. Current NASA observations meanwhile show the 2008-2010 sunspot minimum has come to an end – shown NASA forecast predicts new peak around the year 2013."

"Judging by solar activity a pattern of consecutive cold winters [2008-2009, 2009-2010 & 2010-2011] has come to an end. High pressure blockades (over the North Atlantic, Scotland or Scandinavia) are therefore unlikely to prevail and for Western Europe there could even be another episode of some 5 or 6 years of mild and rainy winters ahead.

"The theory is quite straightforward – and has been known to climatologists for many years: during the winter months solar activity influences air pressure patterns over the Arctic and lower northern hemisphere latitudes.
"In this the number of sunspots is key. When there are few, northern hemisphere westerlies are weaker – and cold air is capable of escaping from the Arctic towards for instance the USA and Europe."
More here.

Tuesday, November 08, 2011

Winter '11 / '12 - Late October Snow - NESIS


NCDC has given the late October snow storm a preliminary score of 1.75 (Category 1) on the NESIS scale.  This is the only October storm to have a NESIS rank.

Multiple daily snowfall records were set during this event (29th - 44; 30th - 103).  Many stations recorded their first ever snowfalls in October.  Still others received the highest daily October snowfall in their recorded history.

The long wave flow regime changed promptly in the storm's aftermath from ridge west-trof east to trof west - ridge east.


Once again...a negative NAO was missing in action during an historic east coast snowfall.
Daily AO...NAO...and PNA indexes here.

Related post:  October Snow Cover

Thursday, November 03, 2011

Winter '11 / '12 - Eurasia Snow Cover - October

The latest monthly data from the Rutgers Snow Lab shows the observed areal snow cover over Eurasia was normal during October.


The chart's orange line marks the month of October's long-term average snow cover.  The dashed yellow lines are one standard deviation above or below the average.

From a statistical process control (SPC) perspective...little variation above or below the mean has occurred in the region since the early '90s.  The early '90s marked the end of a 'warm' convergence resulting from predominantly +ENSO and +PDO conditions in the tropical and extra-tropical Pacific ocean that began in the mid '80s.

Long range seasonal forecasting schemes based on autumnal Eurasia snow cover have received a fair amount of attention in recent years.  The working hypothesis centers around the idea that 'above normal' snow cover in this region during the early fall is a strong leading indicator of colder than normal winter surface air temperatures over the eastern CONUS.

These colder surface air temperatures are thought to be a consequence of upward propagating Rossby waves -- initiated by above normal Eurasia snow cover -- entering the stratosphere which...in turn...weakens or reverses the polar vortex (PV).  A weaken PV is a favorable condition for negative index values of the northern annular oscillations (AO; NAO) which generally lead to below normal temperatures and increased storminess over the eastern CONUS.

The current state of Eurasia's autumnal snow cover does not suggest the eastern CONUS will experience below normal surface air temperatures and/or increased storminess during the upcoming winter. 

Areal snowfall data courtesy Rutgers Snow Lab.

Tuesday, November 01, 2011

Winter '11 / '12 - Season-total Snowfall Forecast Contest - Call for Forecasts!

Central Park - NYC - 1958
NE.Wx's 11th annual ‘Season-total' Snowfall Forecast Contest is the absolute best...biggest...and probably ONLY chance to be recognized for your long-range forecasting acumen.

All you have to do is forecast the season-total snowfall at 25 stations from RDU to CAR.

Deadline: WED...30-NOV-11 @ 11:59 PM EST

Visit the Contest's website to enter your forecast.  Follow the link from 'Enter Season-total Forecast.'

As always...there are NO costs...fees...advertising...or annoying requests for personal information to enter the contest.
---
Forecast element:  sum-total season snowfall @ each station
Forecast period:  01-DEC-11 through 31-MAR-12

Verification:  NWS preliminary climate reports (CLM or F6)
Error statistic:  total absolute error [Σ abs(forecast - observed)]

Update your forecast as often as you want.  Only your last entry will be verified.

---
The reigning NE.Wx ‘Season-Total’ Snowfall Forecasting Champ-een is Roger Smith.  Last year's 'Season-total' forecast summary...verification...and final results ==> here.

---
The Contest is open to amateur and professional forecasters; broadcasters with or without trained Seals; any and all weather-biz types and / or wanna-bees; wish-casters...astrologers...along with any other universally recognized classes of dreamers; Pollyannas or Cassandras...registered Nostradamusts...non-violent megalomaniacs...woolly-bear caterpillars or their agents...pest detectives...NE.Wx NG regulars and lurkers; refugees from AmericanWx and/or USWeather...including self-imposed exiles from Eastern...and of course...meteorologists.

In honor of ne.weather's patron saint Mr. Joseph Bartlo's final request (RIP)...trolls...goats...hat3-lsiters...and psests need not apply.

Sunday, October 30, 2011

Winter '11 / '12 - October Snow Cover

Too bad this classic benchmark storm didn't show its hand early enough to kick-off the 13th Annual NEWxSFC.

UPDATE:  ABE - 6.8

Image courtesy NOHRSC

Friday, October 14, 2011

Winter '11 / '12 - Trending: The North Atlantic Oscillation

The North Atlantic Oscillation (NAO) often plays an important role in defining the character of sensible weather during east coast winters.  It and its godfather the Arctic Oscillation (AO) are also two of the harder features to forecast beyond a week or ten days which leaves seasonal forecasts vulnerable to considerable error.

The developing consensus for Winter '11 / '12 leans heavily on a strengthening la Nina fortified by the trending cool phase of the Pacific Decadal Oscillation (PDO).  These conditions in the eastern Pacific ocean favor a predominantly northern stream storm track passing west of the Appalachian Mountains into northern New England, the result of a blocking ridge axis over the SE CONUS...especially during a positive phase of the Northern Annular oscillations (NAO and AO).

Given the recent trend shown below...how probable is it the phase of NHEMI annular oscillations will be positive this winter?


The time-series above shows the total number of months the NAO was positive or negative during each year.  These data are quite noisy but do show most years during the '50s had greater than or equal number of negative months than positive months and the late '80s to the mid-'90s were dominated by years with more positive months than negative.


Summing the positive and negative months over five years produces a smoother plot and reveals clearly the negative dominance during most of the '50s...the mid-'60s to early '70s...and ever since 2000.  The 'even' line for the period is 30 months.

Positive months held sway between the mid-'80s and much of the '90s during the peak of the AGW war.


Summing the positive and negative months over a decade removes all the noise and shows the positive phase has been the dominant state of the NAO for thirty years (1970 - 2000).  The 'even' line for this period is 60 months.

Coupled with conditions in the Pacific -- evidenced by the initial years of the PDO's cool phase -- the NAO's trending decadal data could be signaling an impending era of colder than 'normal' winters.
---
More later about the correlation between NAO and west Atlantic ocean SST anomalies along with how a la Nina winter can be affected by negative NH annular oscillations..

Friday, October 07, 2011

Winter '11 / '12 - 1st Contact

Up to 9" of snow was observed earlier this week INVOF this picture taken in Snowshoe...W. Va. (map).


Right next door at Hot Springs...VA (KHSP)...winter's preview was observed Monday evening...

020255Z AUTO 28016G22KT 1/4SM -SN OVC003 02/02 A2990 RMK AO2 =
020235Z AUTO 27016G22KT M1/4SM SN OVC001 02/02 A2990 RMK AO2 =
020215Z AUTO 28016G21KT M1/4SM -SN OVC001 02/02 A2990 RMK AO2 =
020158Z AUTO 28017G24KT 1/4SM -SN OVC001 02/02 A2991 RMK AO2 =
020136Z AUTO 27017G21KT M1/4SM -SN OVC001 02/02 A2990 RMK AO2 P0003 =
020115Z AUTO 27018G21KT M1/4SM RA OVC001 02/02 A2991 RMK AO2 P0002 =
020056Z AUTO 27017KT M1/4SM -RA OVC001 01/01 A2991 RMK AO2 P0001 =
020035Z AUTO 28016G20KT M1/4SM SN OVC001 01/01 A2991 RMK AO2 P0001 =
020016Z AUTO 28015G21KT M1/4SM SN OVC001 01/01 A2992 RMK AO2 =
012355Z AUTO 28018G21KT M1/4SM SN OVC001 01/01 A2992 RMK AO2 =
012335Z AUTO 28014KT M1/4SM SN OVC001 01/01 A2992 RMK AO2 =
012315Z AUTO 28015G20KT M1/4SM SN OVC001 01/01 A2992 RMK AO2 =
012255Z AUTO 29017G20KT 1/4SM SN OVC001 01/01 A2992 RMK AO2 =
012235Z AUTO 28016G21KT M1/4SM SN OVC001 01/01 A2992 RMK AO2 =

For more than three hours...HSP vsby met or exceeded blizzard criteria.  Too bad the pressure gradient force was not up to the task.

Thursday, October 06, 2011

Winter '11 / '12 - Quasi-Biennial Oscillation : ENSO

- QBO...having begun its negative phase in August...stands at -2.30 in September.  QBO will remain negative and intensify throughout the upcoming winter.

- ENSO consensus forecast (see Table 1) for D-J-F from the latest numerical and statistical model runs expects a neutral ENSO to 'weak' la Nina.

Forecast SST Anomalies (deg C) in the Niño 3.4 Region

---
Easterly QBO during la Nina favors 1) a cold central US and 2) negative NAO and hi-latitude blocking.
- D'Aleo


Note the negative correlation between the QBO state and geo-potential heights over the Pole and the SE CONUS where a negative / east (positive / west) QBO means heights are positive (negative).  The former implies hi-latitude blocking and the latter suggests la Nina-like ridging.

The polar vortex is weaker and more easily disturbed during easterly QBO and low solar activity.  The current solar cycle is comparatively weak.

"...QBO determines the character of the early winter, leading to a colder and more stable polar vortex in December and January during the west phase of the QBO and a more disturbed and warmer Arctic during the east phase of the QBO."
- SPARC

"Major winter stratospheric warmings preferentially occur during the easterly phase of the QBO..."
- Holton and Tan (1980)

Major warmings can produce deep-layer anti-cyclonic circulations that descend into the troposphere resulting in blocking flow regimes over hi-latitudes.  Blocking is implicated when moderate to strongly negative NAO and AO indexes are observed.

"Pronounced weakenings of the NH wintertime stratospheric polar vortex tend to be followed by episodes of anomalously low surface air temperatures and increased frequency of occurrence of extreme cold events..."
Thompson, et. al. (.pdf)

---


QBO analog year of 'least regret' is 93/94, the bride's maid is 76/77...then it's 83/84...88/89....and finally 64/65.  Some winters can be eliminated when the ENSO is considered.

ENSO state for QBO analog winters are...
93/94:  neutral (+0.2)
76/77:  weakly positive (+0.6)
83/84:  neutral (-0.4)
88/89:  strongly negative (-1.7)
64/65:  weakly negative (-0.8)

Given the currently modeled ENSO forecasts...this winter's best QBO : ENSO analogs appear to favor 83/84...possibly 64/65 if there's strengthening.

More about the analog years and the current state of other analogs NAO/AO/PNA/PDO later...