Wednesday, January 31, 2007

Forecast Credibility


Wx web logs...forums...and message boards were all aflame yesterday with full-throated forecasts for a 'significant' snowfall in advance of the winter storm coming out of the GOM this evening.

Amateurs and pros alike hoisted 48-60 hour forecasts for wide swaths of 4-8" (meets and exceeds NWS warning criteria for heavy snow)...pockets of 6-12"...and 8+".

In light of more recent information...these collectively absurd forecasts have little chance of verifying.

Back in the day...forecasters knew better than to post snowfall forecasts with such long lead times. And they knew better not to segue the MR with the SR. Details portrayed in the the MR are pure fantasy. Timing...intensity...centers of circulation depicted in the MR are purely guidance of impending events. Same is often true about the SR progs...but they are much closer to the truth.

The lead time for a snowfall forecast with the best chance of verifying should be issued no more than 24 hours before the event. The current state of NWP is such that timing...intensity...and centers of circulation is too crude to attempt a forecast at such an extended time range.

A forecaster/s credibility needs to be preserved if they are to be taken seriously. Issuing a snowfall forecast more than two days before the first flakes fly is frought with danger and should be always be avoided.

Monday, January 29, 2007

FWIW - Verification of NCEP Week2 5H Z Anoms


Remember this?


It/s NCEP/s Ensemble Mean forecast for 500 mb height anomalies VT 1/26/2007...issued January 12. So...how good were the action center predictions?

500 mb height anomalies

Negative height anomalies...
...over NE CONUS verified farther N and E over the CN Maritimes
...over SW CONUS had minor displacement error N and W
...along and W of the IDL verified along IDL but farther E over the Aluetians
...over Greenland missed the NAO ridge.

Positive height anomalies...
...NW CN verified spot on
...ATL along ~40°N missed broad trof from CN Maritimes to NW Africa.

Good skill with PNA-type ridge-W...but completely missed the NAO dipole.

500 mb heights

Coastal Teaser #4


Click to animate. Loop speed = 1 frame / 3 sec

Wave forms on tail end of strong baroclinic zone courtesy arctic frontal boundary across the GOM. Dynamics from hot STJ provides the UVM.

Forecast problem is whether the storm will chug harmlessly out to sea or be held closer to the coast from the fx of a shortening wavelength.

Trying to forecast the timing and intensity of the numerous short-waves rotating around the PV is like playing roulette...even at shorter time ranges.

Sooner or later...something good has to come from the combination of the ern 2/3 of the CONUS flooded and continualy refreshed with arctic air and a hi-amp...short wavelength pattern.

Sunday, January 28, 2007

Japan Also Waits for -AO


Japan is on the verge of breaking a long-standing record for latest snowfall.

The current record was set in 1876...when winter/s first snowfall was observed on February 10.

Like much of the CONUS...Japan has experienced a relatively mild winter. The anomalous warmth has been attributed to the persistently positive phase of the AO and ENSO.

Cold air is contained @ hi-latitude during +AO. +ENSO keeps HIGH pressure anchored off Japan/s SE coast in a fashion similar to a La Nina ridge over the SE CONUS.

Resurgent SOI


(Updated below)

Latest 30-day moving average of the SOI is -9.7.

The last time the SOI was that low was the 30-day period ending November 15.

Update:
The -9.7 SOI value is in the top 40% of all negative values since the index went negative last May. It/s also in the top third since the +ENSO began, base on NOAA/s definition (>= 0.5°C), in late September.

Saturday, January 27, 2007

FWIW - Week2 5H Z Anoms


Week2 500 mb height anomalies from the PSD, ECMEF, and NCEP (VT 2/9/06).


Good agreement wrt Ridge-W / Trof E over CONUS...but does it foreshadow any snow?

Some support for -AO tripole with above normal heights over the Pole and below normal heights INVOF Aluetians. Height anomalies in the ern ATL don't fit the pattern...so it/s two out of three.

CPC index forecast from OP GooFuS (blue bars) and the Ensembles (yellow band) suggest at AO will be least one standard deviation below the mean; however, the coefficient of determination (R²) for Op (26%) and Ensemble (21%) are meager. Less than 30% of the AO/s variability is forecast at D+14 by the model. The AO loading pattern can been seen here.


One of the
NAO/s dipoles
finds above normal heights over Greenland @ D+14 ...although not a strong action center. Not much of a weakness across the ATL Ocean...either. CPC/s NAO forecast has the index near zero @ VT. The Op (Ensemble) D+14 forecast has an R² of 21% (7%). Numbers like those don/t lend themselves to awe inspiring confidence.

Note the current state of the NAO; strongly negative which goes along way in explaining why there has been so few EC snowstorms to date. The UA flow regime responsible for the intrusions of arctic air is too strong to support nearshore EC cyclogenesis. The winter storms are out there, it/s just that they/re too far out there...going through their explosive development well offshore.


The PNA dipole of above normal heights over SW CN and below normal heights INVOF the Aluetian Is. is well supported by the three models. PNA index is not particulariliy high -- less than one standard deviation above the mean -- but ridge-W is a 'typical' mid-winter feature. The D+14 forecast for slightly above normal PNA suggests a continuation of arctic airmasses invading the lower 48.


The OP GooFuS captures only 19% of the PNA/s variability; however...the Ensembles are much better (~60%) at getting the magnitude and direction correct.

The current D+14 forecasts has the AO negative to strongly negative..the NAO neutral...and the PNA weakly positive. A recent four-part study of past NEWxSFC storms suggested the best snowfalls...on average...occurred when the AO was positive or when the AO and PNA were both positive. The lowest snowfalls occurred when the AO was negative and the NAO positive.

The present forecast combination of -AO and +PNA @ D+14 has not produced the best Contest snowfalls. Instead of big snows in the E by the end of Week2...what may be more likely is a continuation of arctic cold and arctic dry.

Wednesday, January 24, 2007

Coastal Teaser #3


Most promising MR prog in weeks!

Today/s 12z ECMWF coughs up a long overdue Miller A storm for the EC that has a lot going for it. Even though the chart is not 'perfect,' that/s a good thing at this time range. The last thing you want is perfection in the MR b/c the VT analysis won/t look anything like the 216 HR chart.

Nonetheless...there/s little doubt about the antecedent environment across the ern CONUS that will feature plenty-o-arctic air and a highly amped UA flow regime with short wavelength.

Monday, January 22, 2007

Locked & Loaded


A four Rossby-wave configuration is stationary...meaning once established...it/s not going anywhere...anytime soon. Arctic cold in the E has arrived and the ECMWF/s D+10 prog suggests it/s inclined to take its shoes off and sit a'spell.

In the run-up to D+10...storms are advertised to continue their explosions over the open waters of the wrn ATL due in large part to the rapid succession of upstream kickers. The interval btwn these nrn stream short waves is too short to allow any one of them to dig in its heels over land; however...


...the ECMWF/s D+7 prog shows an important break in the wave train interval that would allow a different scenario to evolve over the EC during the first week of February...just in time for the full Snow Moon.

As the short wave climbs the AK ridge...the ridge amplifies. A second short wave has already rounded the crest and is poised to descend into the LW trof on a direct-deposit trajectory toward the wrn GOM. Unlike previous short waves that are being abruptly kicked downstream and subsequently well offshore into the wrn ATL...this one has ample time and opportunity to dig deep into the base of the full-latitude trof b/c the upstream short wave is still ascending.

The increasing amplitude of the AK ridge has the downstream effect of shortening the wavelength over CONUS...which would allow cyclogenesis to occur much closer to the EC than earlier cyclone deepenings.

So Long...+ENSO


This winter/s +ENSO...oft a convenient scapegoat for the abnormally warm temperatures across much of the CONUS...appears to be fading...and fast.

NOAA/s ENSO definition...based solely on SSTAs in region 3.4...holds that if the anomaly is at least +0.5°C...it/s el Nino. If the anomaly is less than or equal to -0.5°C...then it/s la Nina. The Australians consider the Southern Oscillation Index (SOI)...Outgoing Long wave Radiation (OLR)...trade winds...sub-sea surface temperature anomalies...as well as SSTAs.

There are significant signals...using the Australian criteria...that +ENSO is on-goin..but in its last throes.

ENSO signals...week ending January 21:


1) SOI stands @ -5.5...doubling down from December/s end-of-month value of -2.4. +ENSO is indicated when the SOI is negative.


2) ENSO region 3.4 SSTA 0.57°C...barely above the 0.5°C threshold.

3) Trade winds weaken and reverse direction during +ENSO. Trade winds are currently normal to above normal in the ern portion of region 3.4 and anomalous near the International Dateline. Some have suggested the west wind comes courtesy the MJO...but MJO is still largely voo-doo...so who can say for sure what it means.


4) Above normal sub-sea surface temperarture...such as those shown during November...are supportive of +ENSO conditions. Below normal sub-sea surface temperatures are now reaching well into the ern PAC.


5) OLR has been negative since early January...indicating widespread active convection in the region...and a sign that el Nino is on-going.

Recap
SOI 30-day moving average still weakly negative. SSTAs still above +ENSO threshold but falling fast. OLR negative. Trade winds in flux. Sub-sea surface anomalies trending negative.

+ENSO doesn't usually end during the srn HEMI/s summer...so it probably has some life left...but it/s getting about time to say...'so long.'

Saturday, January 20, 2007

Is A Big One A'comin'?


This winter/s evil-doers -- mT air masses from the ern PAC -- were overthrown last week when the PV made its long-awaited return home to nrn CN. Since then...LR progs have been honking about more regime change late next week...evidenced by NAO and AO forecasts going negative -- NAO strongly so -- and the PNA flirting with +1.

Do these expected changes in three important winter teleconnection indices portend big snows for the NE and M-A toward the end of the upcoming week?

For the answer to that musical question...we look to Ms. Heather Archambault (University at Albany...State University of New York) who co-authored a study in 2004 titled 'Cool-Season Regime Transition and its Impact on Northeast Precipitation' (PPT).

The study/s premise was to examine...
1) the meteorological wisdom that holds there/s an increased threat of a major storm during large–scale regime transition...
2) past research pointing to a connection between synoptic-scale cyclogenesis and reconfiguration of the planetary-scale flow (e.g. Colucci 1985)...and
3) Dave Groenert (CSTAR...2002) documentation of an apparent tendency for increased precipitation in the Northeast during phase transitions of the North Atlantic Oscillation (NAO).

The study took a statistical look at cool-season (Nov – Apr) weather regime transitions and Northeast precipitation anomalies and created a composite analysis for one kind of regime transition. The regimes were defined as +/- NAO and +/- PNA. Study cases were selected if the index anomaly was at least one standard deviation (STD) from the mean.

Regime change was defined as...
1) a significant change in teleconnection index magnitude (2 stdev) over a 7 – day period...
2) teleconnection index phase change...and
3) index at start of transition must be strongly positive or negative (Index>1 stdev).

Bottom line result of the study -- significant changes in LR forecasts for NAO and PNA would give forecasters a one-week advance 'heads up' of an increased potential for major winter storms.

Are Forecaster's Getting Their Heads Up?
No doubt these/s a large scale regime transition going on in across the NHEMI. Geo-potential heights are expected to dramatically rise / fall over Greenland / Azores this week. +PNA is on the way...too.

Will It Be Enough?
At the start of the seven-day run-up period...today/s NAO is -0.37 (slightly below the mean) and forecast to fall to ~ -1.5 STD below the mean...which is not even close to the study/s -2.0 STD threshold. It/s worth noting the study did not indicate whether a sensitivity analysis was done to determine whether a range of slightly higher or lower NAO values altered the final results. It/s possible the STD constraint is too strict and a smaller deviation from the mean...such as -1.5 STD... would sustain the study/s main conclusions.


Like the NAO...the PNA starts out near the mean (0.3) as well. It/s forecast to increase to a smidge more than 1 STD above the mean and like the NAO...the increase in PNA does not meet Archambault/s 2 STD criterion.


Is A Big One A'comin'?
One huge assumption about MR forecasting of significant NE snowstorm lurks beneath the conclusions of 'Cool-Season Regime Transition and its Impact on Northeast Precipitation.' Can MR / LR NWP models accurately predict the state of the NAO and PNA such that the study/s findings can be put to use in an operational environment or do they merely make for interesting post-mortem analysis?

Two measures of skill are the 'correlation coefficient' (R) and its square...the 'coefficient of determination' (R²). R establishes whether there/a a relationship between the forecast and the observed. Does the observed value increase when the forecast indicates an increase? The closer to one the ratio is...the stronger the relationship. The NAO/s (PNA) seven-day forecast correlation co-efficient is ~0.83 (~0.88)...which is a good indicator that when the forecast indicates a change in direction of the index...it will be correct. The model/s ability to capture the variability (as in variance) of the index is measured by R². R² is the square of the correlation co-efficient. The NAO/s (PNA) R² is 69% (77%) ...meaning 69% (77%) of the variability in the observed NAO (PNA) is captured by the model. Respectable values...but not overly so.
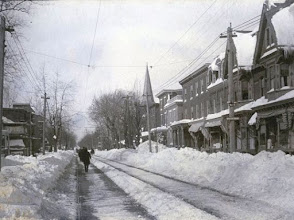
If Archambault et. al./s results are applied to next week/s expected evolution of events along the EC...then nothing 'big' is apt to occur and we/re left waiting and still wanting for the start of some serious winter wx.