Showing posts sorted by date for query eurasia. Sort by relevance Show all posts

Wednesday, October 26, 2022

Winter '22 / '23 - An over-the-horizon look at early autumn's a priori climate conditions

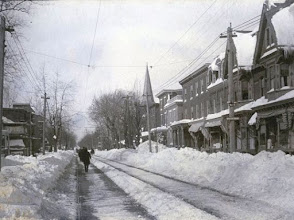
near Woodstock ... VT
Marion Post Wolcott (1940)
TL; DR
- The stars have yet to align for snow crows and other winter wx enthusiasts.
- Above-normal temperatures and below-normal snowfall for most NEWxSFC/s stations.
 
> Warranties neither expressed nor implied.
> User assumes all risk.
> Not intended for use by children.
 
---
Decoder Ring
AO: Arctic Oscillation
CONUS: Continental United States
D-J-F: December-January-February
ENSO: El Niño - Southern Oscillation
EPO: Eastern Pacific Oscillation
M-A: Mid-Atlantic
NE: New England
NAO: North Atlantic Oscillation
NHEMI: Northern Hemisphere
NWP: Numerical Weather Prediction
PDO: Pacific Decadal Oscillation
QBO: Quasi-Biennial Oscillation
PNA: Pacific-North American pattern
SSTa: Sea-Surface Temperature anomaly
SSW: Sudden Stratospheric Warming
 
---
To the extent ENSO ... QBO ... SSTa in the tropical Pacific and the NE coastal waters of CONUS ... sunspots ... PDO ... and the extent of Eurasian cover have any predictive value ... here laid upon the table is the current state of play heading into Winter '22 / '23 as divined from NEWxSFC/s Whirled Headquarters located east of the fall line in VA.

Tuesday, October 11, 2022

Winter '22 / '23 - Eurasia Snow Cover: SEP

Eurasia/s areal snow cover for SEP-22: ~2,520,000 SQ-KM

- Almost 60% above normal (1,620,000 SQ-KM)
- Ranks 6th during period-of-record (1967 - 2022).
- Highest since 1998 (25 years ago).

The extent of Eurasia/s OCT snow cover has been positively correlated with cold and snowy winter weather in the eastern CONUS so we/re off to a good start.

Data courtesy Rutgers University Global Snow Lab

Friday, November 05, 2021

Winter '21 / '22 - Quasi-Biennial Oscillation (QBO): OCT-21

-19.14 (just inside 1-sigma from the mean)

OCT is now the 5th month with a QBO index below zero having flipped in JUN following its 14 month run in positive territory.  The 30mb flow over the Equator oscillates from east to west every 14 months; therefore ... the current easterly state of the QBO is expected to last throughout Winter '21 / '22.

Leading analog years
Winter / ENSO (MEI)
72-73 / W+
00-01 / C-
09-10 / W
91-92 / W+
58-59 / W-

With La Nina temperature anomalies in ENSO Region 3.4 expected to persist through at least late winter ... all QBO analog years are rejected except Winter 00/01.

- Winter '00 / '01
The sum-total of the season-total snowfall for all Contest forecast stations was 1,312".  (~21% above the 1968 - 2021 period-of-record average 1,085".

Eurasia/s OCT areal snow cover slightly below normal.

D-J-F Index Averages
AO:  -1.312
NAO:  +0.040

"The QBO determines the character of the early winter, leading to a colder and more stable polar vortex in December and January during the west phase of the QBO and a more disturbed and warmer Arctic during the east phase of the QBO." [1]

In years with low solar activity (solar cycle 25 is just beginning) ... the polar winter vortex tends to be disturbed and weak when the QBO is easterly.  Positive geopotential height anomalies over high latitudes ... i.e., blocking ... are also correlated with QBO-E and solar minimums.
 
Antecedent odds currently favor a weak and disturbed stratospheric polar vortex and SSW (sudden stratospheric warming) leading to a long-lasting negative Arctic Oscillation (AO) and well-below normal temperatures periodically in eastern North America ... northern Europe ... or eastern Asia.


Tuesday, November 02, 2021

Winter '21 / '22 - Eurasia Snow Cover: OCT-21

Observed:  10,671,792 km^2
Average:  10,310,000 km^2
Median:  10,130,000 km^2

3.5% (5.3%) above normal (median)
Rank:  19 (n = 54)

Above average snow cover observed in 10 of the past 10 OCTs.
At least 1 standard deviation above normal snow cover in 5 of the last 10 OCTs.

Top Analog Winters (weight) / ENSO state / QBO state
1 - 2009/10 (2x) / W / E
2 - 2001/02 (2x) / nada- / W
3 - 2020/21 (1x) / C / W
4 - 2019/20 (1x) / nada+ / E
5 - 2015/16 (1x) / W+ / W

These analog winters have questionable predictive value b/c a moderate La Nina (C) and QBO-E are expected to prevail during Winter '21 / '22.

Blue markers located between the inner and outer circle have a weak yet statistically significant (p <= 0.05) positive correlation between Eurasia/s OCT areal snow cover and a forecast station/s season-total snowfall.  Strongest correlations found in New England where correlations range between 0.269 (BTV) and 0.376 (ORH).

A paultry ~16% of the variability (R2 = 0.158) in combined season-total snowfall from all forecast stations is explained by Eurasia/s OCT areal snow cover. 

---
Period-of-Record:  1967 - 2021 (1969:  no data)
Data courtesy Rutgers Global Snow Lab

Previous posts about Eurasia's OCT areal snow cover here

Tuesday, November 03, 2020

Winter '20 / '21 - Eurasia Snow Cover: OCT

~ 11,000,000 SQ-KM


Under-performing all year ... 

6% above P-O-RN (~10,320,000 SQ-KM)
9% above median (~10,080,000 SQ-KM)
Period-of-Record:  53 years
Rank: 19th

2nd lowest past 10 years
16 of past 20 years above P-O-R-N

OCT-19:  ~12,700,000 SQ-KM
OCT-20:  14% less than last year

Eurasia snow analog years offer little if any guidance given this winter should have cool ENSO / PDO and QBO-W.

---
P-O-RN ==> period-of-record normal

Data courtesy Rutgers University Global Snow Lab
http://climate.rutgers.edu/snowcover/index.php

Thursday, November 07, 2019

Winter '19 / '20 - Eurasia Snow Cover: OCT

Eurasia/s areal snow cover for OCT-19: ~ 12,800,000 SQ-KM
24% above 52-year P-O-R-N (~10,300,000 SQ-KM)
27% above 52-year median (~10,100,000 SQ-KM)

Rank: 7th
3rd highest past 10 years
4 of past 20 years below median ('05 ... '07 ... '08 ... '11)
OCT-18:  ~10,400,000 SQ-KM
OCT-19: 23% greater than OCT-18


Ranked analog years 500 mb anomaly height composite for Winter '19 / '20
('15 / '16 ... '16 / '17 ... '09 / '10 ... '01 / '02 ... '14 / '15)

- High 500 mb geopotential heights at hi-latitude ==> NAO & AO < 0
- EPO > 0 ==> fast zonal flow over CONUS & mild PAC air masses
-weak evidence of trof over coastal M-A & NE CONUS


CORRECTION:  '15 / '16 & '09 / '10 ENSO should be 'W+'

Key
ENSO:  nada- (-0.5 < Region 3.4 SSTa <  0); C- (weak La Nina); W- (weak El Niño)
NAO:  sign of D-J-F average
AO:  sign of D-J-F average
PDO:  sign of O-N-D-J-F-M average
QBO:  + ==> west; - ==> east

Friday, November 01, 2019

Winter '19 / '20 - Eurasia/s OCT Snow Advancement

 UPDATE (31-OCT-19)
Dr. Cohen via Tweeter ..."... the snow cover advance index came in at +0.6.

 "This does suggest a negative winter Arctic Oscillation and upcoming #PolarVortex disruption."


---
UPDATE (29-OCT-19)
Dr. Cohen via Tweeter ... "October SCE will likely be more than one standard deviation above normal.

"My research shows this favors colder winter temperatures across the N Hemisphere mid-latitudes including East US (sic)"

Friday, October 18, 2019

Winter '19 / '20 - Statistical Winter Outlook: Solar cycle and ENSO

Severe Weather Europe's (SWE) analysis of the solar cycle and ENSO analogs ...


"After removing all the cold phases and strong warm phases of ENSO, we get a very interesting and more defined picture. We see a high pressure area focused over Greenland and the Arctic, typical for negative NAO & AO.

"Lower pressure is displaced a bit further south, along with polar fronts and colder air. This type of pattern usually brings colder and snowy weather to Europe and USA."

SWE/s solar cycle / ENSO analysis in general agreement with our current QBO ... AO ... and Eurasia snow cover analogs.

Tuesday, October 08, 2019

Winter '19 / '20 - Eurasia Snow Cover: SEP

Eurasia/s areal snow cover for SEP-19: ~1,570,000 SQ-KM

3% below 48-year P-O-R-N (~1,629,000 SQ-KM)
1% below 48-year Median (~1,588,000 SQ-KM)

Rank: 26th
4th lowest past 10 years
11 of past 20 years below median
SEP-18:  ~1,300,000 SQ-KM
SEP-19 21% greater than SEP-18


KEY
ENSO:  nada+ (0 < SSTa <  0.5); C- (weak La Nina); W- (weak El Niño); W (moderate El Niño); W+ (strong El Niño)
NAO:  sign of D-J-F average
PDO:  sign of O-N-D-J-F-M average
QBO:  + ==> west; - ==> east

Saturday, September 28, 2019

Winter '19 / '20 - Eurasian Snow Cover: AUG

Eurasia/s areal snow cover for AUG-19:  ~158,300 km2


-61% below 48-year P-O-R-N (~403,000 km2)
-46% below 48-year Median (~294,000 km2)
Rank: 39th

7th highest past 10 years
19 of past 20 years below median
 Last year:  ~140,800 km2

Analog years for winter '19 / '20
CORRECTION:  Second instance of 15/16 should be 16/17
---
Snow cover data courtesy Rutgers University Global Snow Lab
http://climate.rutgers.edu/snowcover/index.php

Sunday, November 11, 2018

Winter '18 / '19 - Eurasia Snow Cover: OCT

Eurasia/s areal snow cover for OCT-18:  ~10,391,000 km2

Last year:  ~12,052,000 km2

1% above 53-year P-O-R-N (~10,260,000 km2)
Rank: 22nd

Lowest in eight years

Seven of the last ten years above normal

Analog years for winter '18 / '19
Rank Winter ENSO
1 82-83 W+
2 00-01 C-
3 69-70 W-
4 01-02 nada-
5 84-85 C

---
Data courtesy Rutgers University Global Snow Lab
http://climate.rutgers.edu/snowcover/index.php

Saturday, November 10, 2018

Winter '18 / '19 - Snow Advance Index and Season-total Snowfall in the NE and Mid-Atlantic

The Snow Advance Index (SAI) measures the mean daily rate-of-change in Eurasia's areal snow cover at latitudes equatorward of 60°N during OCT.  Published research suggests rapid increases in Eurasia/s OCT areal snow cover are associated with increased season-total snowfall (STP) in the eastern U.S.

Does the SAI provide useful guidance for season-total snowfall at NEWxSFC forecast stations?

Meh ... me thinks.

This analysis looks at the relationship between the SAI and NEWxSFC stations' STP for the winters between '70 / '71 and '17' / '18 (n = 48).

PCT increase in areal coverage is proxy for the mean rate of change of snow cover extent (SCE) from daily snow cover data in the above referenced study. (Cohen and Jones 2011).

AVG PCT increase in weekly Eurasian areal snow cover between Week 40 and Week 44 (OCT):  416% (ORANGE LINE)

OCTs ... where SAI > AVG:  20

Accordingly ... if OCT/s SAI is above AVG ... then STP at NEWxSFC forecast station should also be > AVG.

---
AVG 'season-total' snowfall (STP) for NEWxSFC forecast stations:  1,042" (GREEN LINE)
Winters ... where STP > AVG:  23

---
The question the analysis wants to answer:
Does the SAI-proxy - PCT increase in Eurasia/s OCT snow cover - predict whether NEWxSFC forecast stations' STP > AVG.

---
Years ... where SAI > AVG & Years ... where NEWxSFC stations' STP > AVG:  11 (RED DOTS)
Recall ... there were 20 years when OCT/s SAI > AVG which means nine years the STP < AVG.

Probability of  OCT SAI > AVG:  42% (20/48)
For any given OCT ... there's a 42% chance of SAI > AVG.

Probability NEWxSFC stations STP > AVG:  48% (23/48)
For any given year ... there's a 48% chance of STP > AVG.

What's the probability given SAI > AVG ... the STP will also be > AVG?
Cumulative probability for NEWxSFC stations STP > AVG ... given SAI > AVG:  42%

---
BOTTOM LINE:  In any given year ... if the SAI > AVG ... there's a 42% chance the 'season-total' snowfall ... for all NEWxSFC forecast stations ... will be above the period of study's AVG 'season-total' snowfall.

Looking at it another way ... there's a 58% chance the 'season-total' snowfall ... for all NEWxSFC forecast stations ... will _not_ be above the period of study's AVG 'season-total' snowfall.  This isn't to say SAI doesn't offer useful guidance for individual NEWxSFC forecast stations.

OCT-18/s PCT snow cover increase is just under 500% or ~80 PCT-points > AVG; therefore ... there/s a mere 42% chance this season the STP from NEWxSFC/s forecast stations will be > AVG.

Saturday, October 13, 2018

Winter '17 / '18 - Correlation of Eurasia's OCT Snow Cover and Season-total Snowfall in NE and M-A Regions

REPOST from OCT-17 (lightly edited for clarity)
Updated with Winter '17 / '18 verifications for RIC and NYC and their outlooks for Winter '18 / '19

---
The correlation between the areal coverage of Eurasia/s OCT snow cover and season-total snowfall has become broad-brushed conventional wisdom (CW) following the innovative research by AER climatologist Dr. Judah Cohen.

But ... just how well does the CW hold up for NEWxSFC/s forecast stations across New England (NE) and the mid-Atlantic (M-A) regions?

To find out ... monthly period-of-record areal snow cover data for Eurasia from Rutgers Global Snow Lab were correlated with season-total snowfall data for the 27 NEWxSFC/s stations.

A positive and statistically significant correlation means the greater the areal snow cover over Eurasia in OCT ... the greater the season-total snowfall for the following winter.

An Excel radar chart shown below depicts the results of the analysis.

DISCUSSION:  Stations between the inner and outer rings have a positive correlation coefficient statistically different than zero.  The coefficients range between 0.289 (CAR) and 0.424 (ORH).   Correlation values in this range are classified generally as 'low' (moderate:  >= 0.5 - 0.7; strong:  >= 0.7 - 0.9).  Even though the correlations are weak ... they can still provide useful information for seasonal snowfall forecasts.

Translation:  greater season-total snowfall over select stations in the NE and M-A is correlated with greater OCT areal snow cover in Eurasia.

---
The analysis showed other significant correlations of interest.

- RIC/s season-total snowfall has a positive correlation with Eurasia/s AUG areal snow cover.
Eurasia/s AUG-17 snow cover was well below normal ==> lower season-total snowfall @RIC this winter.

VERIFICATION Winter '17 / '18:  RIC STP 12.4"  (AVG:  13.2")
OUTLOOK Winter '18 / '19:  Eurasia's AUG snow cover below average ==> STP below AVG

- NYC/s season-total snowfall has a negative correlation with Eurasia's JUN areal snow cover.
Eurasia/s JUN-17 snow cover was above normal ==> lower season-total snowfall @ NYC this winter.

VERIFICATION Winter '17 / '18:  NYC STP 35.4"  (AVG:  26.1")
OUTLOOK Winter '18 / '19:  Eurasia's JUN snow cover below average ==> STP above AVG

GREEN (RED):  positive (negative) correlation between monthly Eurasian areal snow cover and season-total snowfall.

VERIFICATION Winter '17 / '18
Eurasia's OCT-17 areal snow cover was greater than average (12,051,667 km^2 v 10,261,134 km^2).
Positive correlations for the stations listed below suggest Winter '17 / '18 STP would be above average

STN:  STP" / AVG"
ABE:  46 / 31.4
BOS:  58.6 / 41.6
BTV:  81.5 / 69.8
PWM:  91.1 / 63.8

---
FINDINGS:  data analysis supports the CW for NE forecast stations but not so much across the M-A.

Tuesday, November 07, 2017

Winter '17 / '18 - Eurasia Snow Cover - OCT

12,052,000 km2
18% above 52-year P-O-R-N (10,225,000 km2)

Rank: 11th
Lowest in five years

Eight of the last nine October above period-of-record-normal

Analog years for winter '17 / '18
Rank Winter ENSO
1 06-07 W-
2 69-70 W-
3 77-78 W-
4 00-01 C-
5 98-99 C+

---
Data courtesy Rutgers University Global Snow Lab
http://climate.rutgers.edu/snowcover/index.php

Sunday, November 05, 2017

Winter '17 / '18 - Eurasia Snow Cover - OCT - Snow Advance Index (SAI)

OCT-17's snow advance index is negative.
Snow Crow suicide watch now in effect.

---
AER reports a statistically significant correlation between their 'winter severity index' and how quickly Eurasian snow cover advances during OCT.

They define the 'winter severity index' by the state of the North Atlantic Oscillation / Arctic Oscillation (N/AO) and interpret it as an indicator of 'high latitude' blocking potential during D-J-F.

More blocking.
More winter.
More better.

Here's the model ...
"When snow cover advances rapidly (slowly) across Eurasia in October, this is an indication that the upcoming winter will be more severe (milder) for the Eastern US [sic], Europe and East Asia.


Study period seems surprisingly short seeing how contiguous monthly Eurasian snow cover data begins in 1970.  How well does the SAI correlate with the N/AO index prior to 1988?

---
Snow Advance Index (SAI) backgrounder from AER here.
Earlier Eurasia snow cover posts here.

Sunday, October 29, 2017

Winter '17 / '18 - Eurasia Snow Cover - OCT Preview

Cohen projecting above normal Eurasia snow cover for OCT ahead of an expected weak La Nina winter (D-J-F).

Nine previous weak La Nina winters ... including the famed 1995 - 1996 season ... have been observed during the Eurasia snow cover period of record (1967 - 2016). Only two NEWxSFC forecast stations -- BGM and ALB -- have a statistically significant correlation between season-total snowfall and above normal Eurasia snow cover.


Related:
Winter '17 / '18 - Correlation of Eurasia's OCT Snow Cover and Season-total Snowfall in NE and M-A Regions 

Monday, December 01, 2014

Winter '14 / 15 - Arctic Oscillation Analysis and Forecasts

New blog devoted to the Arctic Oscillation (AO) ... Siberian snow cover ... and more authored by Atmospheric and Environmental Research's (AER) Judah Cohen and Jason Furtado.

Cohen ... et al ... discovered the strong correlation between the areal coverage ... advancement rate of Eurasia/s OCT snow cover and the character of northern hemisphere's winter as modulated by the AO.

Snow Advancement Index (SAI)

The chart reports a correlation index (r) of 0.810 indicating the AO and SAI often move in tandem. 
Squaring the correlation index gives the 'coefficient of determination'; a measure of how much of the variability of one (DJFM AO) is explained by the other (SAI). The SAI 'explains' 66% of DJFM/s AO variability.
 
---
Cohen/s 2013 interview with the WAPO
Cohen/s 2014 interview with the WAPO
Snow cover data from Rutgers Global Snow Lab
 
 
 ---
AER offers a 'notify new post' form requiring personal contact information.
Or use the free Change Detection web page monitoring service.

Sunday, November 24, 2013

Winter '13 / '14 - Outlooks

Thread updated periodically as new outlooks and forecasts are issued from a variety of sources.

---
WxAmerica...

Since this upcoming winter season looks to be close to climatology (normal/mean appearance), the harshest period of December 23 - February 14 will likely be characterized by strong and persistent high-latitude blocking.
Whereas November and the first three weeks of December will likely have a more "up and down" or erratic character, suppressed storm tracks and strong Arctic intrusions are likely in the dead of winter.
The "January Thaw" may be short, with the potential for a fairly vast -EPO/-AO/-NAO alignment keeping colder air in play.

---
Climate Prediction Center 0.5 month long-lead (Last Call!)...