Showing posts sorted by relevance for query eurasia. Sort by date Show all posts

Saturday, October 13, 2018

Winter '17 / '18 - Correlation of Eurasia's OCT Snow Cover and Season-total Snowfall in NE and M-A Regions

REPOST from OCT-17 (lightly edited for clarity)
Updated with Winter '17 / '18 verifications for RIC and NYC and their outlooks for Winter '18 / '19

---
The correlation between the areal coverage of Eurasia/s OCT snow cover and season-total snowfall has become broad-brushed conventional wisdom (CW) following the innovative research by AER climatologist Dr. Judah Cohen.

But ... just how well does the CW hold up for NEWxSFC/s forecast stations across New England (NE) and the mid-Atlantic (M-A) regions?

To find out ... monthly period-of-record areal snow cover data for Eurasia from Rutgers Global Snow Lab were correlated with season-total snowfall data for the 27 NEWxSFC/s stations.

A positive and statistically significant correlation means the greater the areal snow cover over Eurasia in OCT ... the greater the season-total snowfall for the following winter.

An Excel radar chart shown below depicts the results of the analysis.

DISCUSSION:  Stations between the inner and outer rings have a positive correlation coefficient statistically different than zero.  The coefficients range between 0.289 (CAR) and 0.424 (ORH).   Correlation values in this range are classified generally as 'low' (moderate:  >= 0.5 - 0.7; strong:  >= 0.7 - 0.9).  Even though the correlations are weak ... they can still provide useful information for seasonal snowfall forecasts.

Translation:  greater season-total snowfall over select stations in the NE and M-A is correlated with greater OCT areal snow cover in Eurasia.

---
The analysis showed other significant correlations of interest.

- RIC/s season-total snowfall has a positive correlation with Eurasia/s AUG areal snow cover.
Eurasia/s AUG-17 snow cover was well below normal ==> lower season-total snowfall @RIC this winter.

VERIFICATION Winter '17 / '18:  RIC STP 12.4"  (AVG:  13.2")
OUTLOOK Winter '18 / '19:  Eurasia's AUG snow cover below average ==> STP below AVG

- NYC/s season-total snowfall has a negative correlation with Eurasia's JUN areal snow cover.
Eurasia/s JUN-17 snow cover was above normal ==> lower season-total snowfall @ NYC this winter.

VERIFICATION Winter '17 / '18:  NYC STP 35.4"  (AVG:  26.1")
OUTLOOK Winter '18 / '19:  Eurasia's JUN snow cover below average ==> STP above AVG

GREEN (RED):  positive (negative) correlation between monthly Eurasian areal snow cover and season-total snowfall.

VERIFICATION Winter '17 / '18
Eurasia's OCT-17 areal snow cover was greater than average (12,051,667 km^2 v 10,261,134 km^2).
Positive correlations for the stations listed below suggest Winter '17 / '18 STP would be above average

STN:  STP" / AVG"
ABE:  46 / 31.4
BOS:  58.6 / 41.6
BTV:  81.5 / 69.8
PWM:  91.1 / 63.8

---
FINDINGS:  data analysis supports the CW for NE forecast stations but not so much across the M-A.

Tuesday, November 11, 2008

Eurasia Snow Cover - OCT '08 - Part II

October/s numbers for Eurasia areal snow cover are in and it ain/t pretty if you/re on the east coast and in the market for cold this winter.

Eurasia snow cover...Siberia specifically...is correlated negatively to east CONUS winter temperature in AER/s sCAST model...so as Eurasia snow cover goes...so goes sCAST.

Observed snow cover (L) Departures (R)

The Global Snow Lab @ Rutgers U. reports Eurasia areal snow cover for OCT @ 8.88 km² (25th percentile)...which is 13% below the period-of-record average (1967-2008) of 10.2 km². This compares to an -8% departure in NHEMI snow cover.


Eurasia/s OCT snow cover has been above average six (6) times during the past 10 years...most recently in 2006. Last year/s departure was -16%...which is not substantially different than this year. The '07 / '08 winter produced bonus snows across northern NE and disappointing totals elsewhere.


Snowfall departure analysis courtesy NCDC.

Other NEWxSFC posts about sCAST here.

Sunday, October 29, 2017

Winter '17 / '18 - Eurasia Snow Cover - OCT Preview

Cohen projecting above normal Eurasia snow cover for OCT ahead of an expected weak La Nina winter (D-J-F).

Nine previous weak La Nina winters ... including the famed 1995 - 1996 season ... have been observed during the Eurasia snow cover period of record (1967 - 2016). Only two NEWxSFC forecast stations -- BGM and ALB -- have a statistically significant correlation between season-total snowfall and above normal Eurasia snow cover.


Related:
Winter '17 / '18 - Correlation of Eurasia's OCT Snow Cover and Season-total Snowfall in NE and M-A Regions 

Thursday, November 03, 2011

Winter '11 / '12 - Eurasia Snow Cover - October

The latest monthly data from the Rutgers Snow Lab shows the observed areal snow cover over Eurasia was normal during October.


The chart's orange line marks the month of October's long-term average snow cover.  The dashed yellow lines are one standard deviation above or below the average.

From a statistical process control (SPC) perspective...little variation above or below the mean has occurred in the region since the early '90s.  The early '90s marked the end of a 'warm' convergence resulting from predominantly +ENSO and +PDO conditions in the tropical and extra-tropical Pacific ocean that began in the mid '80s.

Long range seasonal forecasting schemes based on autumnal Eurasia snow cover have received a fair amount of attention in recent years.  The working hypothesis centers around the idea that 'above normal' snow cover in this region during the early fall is a strong leading indicator of colder than normal winter surface air temperatures over the eastern CONUS.

These colder surface air temperatures are thought to be a consequence of upward propagating Rossby waves -- initiated by above normal Eurasia snow cover -- entering the stratosphere which...in turn...weakens or reverses the polar vortex (PV).  A weaken PV is a favorable condition for negative index values of the northern annular oscillations (AO; NAO) which generally lead to below normal temperatures and increased storminess over the eastern CONUS.

The current state of Eurasia's autumnal snow cover does not suggest the eastern CONUS will experience below normal surface air temperatures and/or increased storminess during the upcoming winter. 

Areal snowfall data courtesy Rutgers Snow Lab.

Tuesday, November 02, 2021

Winter '21 / '22 - Eurasia Snow Cover: OCT-21

Observed:  10,671,792 km^2
Average:  10,310,000 km^2
Median:  10,130,000 km^2

3.5% (5.3%) above normal (median)
Rank:  19 (n = 54)

Above average snow cover observed in 10 of the past 10 OCTs.
At least 1 standard deviation above normal snow cover in 5 of the last 10 OCTs.

Top Analog Winters (weight) / ENSO state / QBO state
1 - 2009/10 (2x) / W / E
2 - 2001/02 (2x) / nada- / W
3 - 2020/21 (1x) / C / W
4 - 2019/20 (1x) / nada+ / E
5 - 2015/16 (1x) / W+ / W

These analog winters have questionable predictive value b/c a moderate La Nina (C) and QBO-E are expected to prevail during Winter '21 / '22.

Blue markers located between the inner and outer circle have a weak yet statistically significant (p <= 0.05) positive correlation between Eurasia/s OCT areal snow cover and a forecast station/s season-total snowfall.  Strongest correlations found in New England where correlations range between 0.269 (BTV) and 0.376 (ORH).

A paultry ~16% of the variability (R2 = 0.158) in combined season-total snowfall from all forecast stations is explained by Eurasia/s OCT areal snow cover. 

---
Period-of-Record:  1967 - 2021 (1969:  no data)
Data courtesy Rutgers Global Snow Lab

Previous posts about Eurasia's OCT areal snow cover here

Friday, November 01, 2019

Winter '19 / '20 - Eurasia/s OCT Snow Advancement

 UPDATE (31-OCT-19)
Dr. Cohen via Tweeter ..."... the snow cover advance index came in at +0.6.

 "This does suggest a negative winter Arctic Oscillation and upcoming #PolarVortex disruption."


---
UPDATE (29-OCT-19)
Dr. Cohen via Tweeter ... "October SCE will likely be more than one standard deviation above normal.

"My research shows this favors colder winter temperatures across the N Hemisphere mid-latitudes including East US (sic)"

Saturday, November 10, 2018

Winter '18 / '19 - Snow Advance Index and Season-total Snowfall in the NE and Mid-Atlantic

The Snow Advance Index (SAI) measures the mean daily rate-of-change in Eurasia's areal snow cover at latitudes equatorward of 60°N during OCT.  Published research suggests rapid increases in Eurasia/s OCT areal snow cover are associated with increased season-total snowfall (STP) in the eastern U.S.

Does the SAI provide useful guidance for season-total snowfall at NEWxSFC forecast stations?

Meh ... me thinks.

This analysis looks at the relationship between the SAI and NEWxSFC stations' STP for the winters between '70 / '71 and '17' / '18 (n = 48).

PCT increase in areal coverage is proxy for the mean rate of change of snow cover extent (SCE) from daily snow cover data in the above referenced study. (Cohen and Jones 2011).

AVG PCT increase in weekly Eurasian areal snow cover between Week 40 and Week 44 (OCT):  416% (ORANGE LINE)

OCTs ... where SAI > AVG:  20

Accordingly ... if OCT/s SAI is above AVG ... then STP at NEWxSFC forecast station should also be > AVG.

---
AVG 'season-total' snowfall (STP) for NEWxSFC forecast stations:  1,042" (GREEN LINE)
Winters ... where STP > AVG:  23

---
The question the analysis wants to answer:
Does the SAI-proxy - PCT increase in Eurasia/s OCT snow cover - predict whether NEWxSFC forecast stations' STP > AVG.

---
Years ... where SAI > AVG & Years ... where NEWxSFC stations' STP > AVG:  11 (RED DOTS)
Recall ... there were 20 years when OCT/s SAI > AVG which means nine years the STP < AVG.

Probability of  OCT SAI > AVG:  42% (20/48)
For any given OCT ... there's a 42% chance of SAI > AVG.

Probability NEWxSFC stations STP > AVG:  48% (23/48)
For any given year ... there's a 48% chance of STP > AVG.

What's the probability given SAI > AVG ... the STP will also be > AVG?
Cumulative probability for NEWxSFC stations STP > AVG ... given SAI > AVG:  42%

---
BOTTOM LINE:  In any given year ... if the SAI > AVG ... there's a 42% chance the 'season-total' snowfall ... for all NEWxSFC forecast stations ... will be above the period of study's AVG 'season-total' snowfall.

Looking at it another way ... there's a 58% chance the 'season-total' snowfall ... for all NEWxSFC forecast stations ... will _not_ be above the period of study's AVG 'season-total' snowfall.  This isn't to say SAI doesn't offer useful guidance for individual NEWxSFC forecast stations.

OCT-18/s PCT snow cover increase is just under 500% or ~80 PCT-points > AVG; therefore ... there/s a mere 42% chance this season the STP from NEWxSFC/s forecast stations will be > AVG.

Tuesday, October 11, 2022

Winter '22 / '23 - Eurasia Snow Cover: SEP

Eurasia/s areal snow cover for SEP-22: ~2,520,000 SQ-KM

- Almost 60% above normal (1,620,000 SQ-KM)
- Ranks 6th during period-of-record (1967 - 2022).
- Highest since 1998 (25 years ago).

The extent of Eurasia/s OCT snow cover has been positively correlated with cold and snowy winter weather in the eastern CONUS so we/re off to a good start.

Data courtesy Rutgers University Global Snow Lab

Friday, January 06, 2012

Winter '11 / '12 - Eurasia Snow Cover - December

The latest monthly data from the Rutgers Snow Lab shows the observed areal snow cover over Eurasia was -- yawn -- average during December after being at or quite close to one standard deviation above the mean the past two years.

The month's ~26,642,000 km² coverage ranked 26th in the 46-year period of record (1966 - 2011) which is slightly less than the median December coverage of ~26,786,000 km².


Solid ORANGE line:  period of record's AVERAGE areal snow cover.
Dashed YELLOW lines:  + / - one standard deviation about the mean
RED line:  nine-point binomial filter

---
Snowfall data courtesy Rutgers Snow Lab.
Earlier post about Novembers' Eurasia snow cover here.

---
BONUS chart...
Monthly Eurasian snow cover for 2011 (RED line; BLUE markers) and the 'period of record' median.


Friday, November 28, 2008

sCAST - Winter '08 / '09

AER/s sCAST has been released in past years in late NOV or early DEC. No sign of it yet...but while we wait...here/s a thumbnail sketch about how it works.

sCAST considers these elements when making its winter forecast:
  • Eurasia/s OCT snow cover
  • Sea level perssures
  • Air temperatures
  • Atmosphereic energy flux
  • ENSO state
  • Global warming trend
  • NAO / AO state
  • sCAST developer Dr. Judah Cohen explains...
    "...the link between October snow cover in Siberia and the Northern Hemisphere's winter temperatures, and snowfall.

    "October is the month when snow begins to pile up across Siberia. October is also the month that the Siberian high, one of three dominant weather centers across the Northern Hemisphere, forms.

    "In years when Siberian snow cover is above normal, a strengthened Siberian high and colder surface temperatures across Northern Eurasia develop in the fall.


    ""The result is a warming in Earth's stratosphere that occurs in January," said Cohen. "This eventually descends from the stratosphere to Earth's surface over a week or two in January, making for a warmer winter in Northern Hemisphere high latitudes. However, in mid-latitudes it turns colder, so winters in the northeastern U.S. and eastern Europe are likely to be colder and snowier than normal."
    Eurasia/s OCT 2008 snow cover of 8.88 km² was 13% below PORN (10.19 km²) this year... suggesting a generally mild winter b/c NAO/AO will be positive in JAN. Positive NAO/AO are a consequence of a strong polar vortex which keeps the coldest air at high latitudes.

    Tuesday, November 06, 2012

    Winter '12 / '13 - Eurasia Snow Cover - October

    Period of record median:  9,599,610 km²
    October-12:  11,106,205 km²

    October-12 Eurasia snow cover...as reported by Rutgers Snow Lab...is 16% above normal.  This bodes well for a cold and snowy winter in the eastern US...according to the statistically significant correlation between these global two features discovered by AER's Dr. Judah Cohen.

    ...Eurasian snow cover during this year’s October has increased far more rapidly than...is normally the case (the corresponding index value exceeds two-standard deviations).

    Given the large anomaly for the predictor variable, the following winter will be a good test for assessing if the approach is suitable for real-time seasonal forecasts.1
    Eurasia OCT snow cover : season-total snowfall (D-J-F-M) at NE and MA Contest stations in recent winters...
    '09 / '10:  11,288,371 km² - 1,225" (observed*) v. 908" (normal*)
    '10 / '11:  10,615,933 km² - 1,426" (observed) v. 921" (normal)
    '11 / '12:  9,293,740 km² - 393" (observed) v. 934" (normal)

    * SBY removed for lack of station snowfall data.


    Blue dotted - observed snow cover
    Red - 9-point binomial filter
    Orange - period of record median snow cover
    Yellow dashed - one standard deviation

    The 9-point binomial fiter shows the long-term trend by removing noise from the signal.


    ---
    Reading room...
    - A new index for more accurate winter predictions (pdf)
    GEOPHYSICAL RESEARCH LETTERS, VOL. 38, L21701

    - Eurasian Snow Cover Variability and Links with Stratosphere-Troposphere
    Coupling and Their Potential Use in Seasonal to Decadal Climate Predictions (pdf)
    Climate Test Bed Joint Seminar Series
    NCEP, Camp Springs, Maryland, 22 June 2011

    Tuesday, December 06, 2011

    Winter '11 / '12 - Eurasia Snow Cover - November

    The latest monthly data from the Rutgers Snow Lab shows the observed areal snow cover over Eurasia was more than one standard deviation above normal during November for the 2nd time in three years.  It was the 5th highest coverage during the period of record (1966 - 2011).


    Other Novembers where the snow cover was more than one standard devaition above the long term mean occured in 2009...1993...1973...1972...1970...and 1968.

    Note the cluster of above normal Novembers between 1968 and 1973.  What the 3 out of 4 years had in common were negative PDO...negative QBO...and negative NAO.

    Areal snowfall data courtesy Rutgers Snow Lab.
    Earlier post about Octobers' Eurasia snow cover here.

    Monday, November 02, 2009

    Winter '09 / '10 - NHEMI Snowcover - October


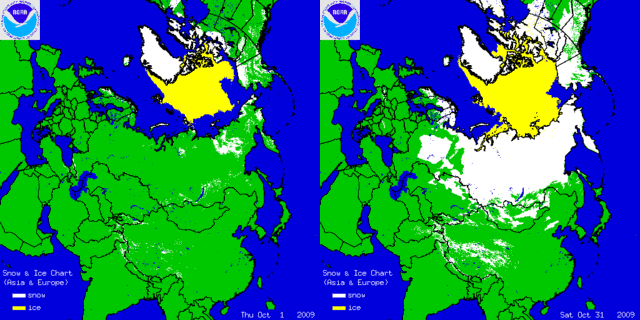
    Snow cover over-spread EURASIA rapidly in October...just as it does every year.

    NHEMI snow cover is above normal...a somewhat common phenomenon this decade.  Recovery was rapid...after falling ~2% below normal seven or so days into the month.

    Snow cover anomaly is over land areas between 35°N and 55°N is currently +6%.

    Good autumn snow cover over EURASIA plays an important role in defining winter's character. It perturbs the troposphere in such a way as to weaken the polar vortex (PV).  Arctic air masses are better able to drain into lower latitudes when the PV is weak. The PV is also weaker when the QBO is east...as it will be this winter.  More about EURASIAN snowcover/s predictive role in winter/s wx here.


    The combination of rich snow cover in EURASIA and QBO-east could provide the impetus for hi-latitude blocking and a persistently negative state of the northern annular oscillations known as the Arctic Oscillation and the North American Oscillation... which favors above-normal season-total snowfall in the NE and mid-Atlantic regions.  +ENSO-related +PNA and an active lo-latitude / southern-tier storm track should provide ample opportunity for phasing and strong Miller-A cyclogenesis along the eastern seaboard.

    More global snowcover charts @ FSU...NOAA...and Rutgers

    Sunday, November 05, 2017

    Winter '17 / '18 - Eurasia Snow Cover - OCT - Snow Advance Index (SAI)

    OCT-17's snow advance index is negative.
    Snow Crow suicide watch now in effect.

    ---
    AER reports a statistically significant correlation between their 'winter severity index' and how quickly Eurasian snow cover advances during OCT.

    They define the 'winter severity index' by the state of the North Atlantic Oscillation / Arctic Oscillation (N/AO) and interpret it as an indicator of 'high latitude' blocking potential during D-J-F.

    More blocking.
    More winter.
    More better.

    Here's the model ...
    "When snow cover advances rapidly (slowly) across Eurasia in October, this is an indication that the upcoming winter will be more severe (milder) for the Eastern US [sic], Europe and East Asia.


    Study period seems surprisingly short seeing how contiguous monthly Eurasian snow cover data begins in 1970.  How well does the SAI correlate with the N/AO index prior to 1988?

    ---
    Snow Advance Index (SAI) backgrounder from AER here.
    Earlier Eurasia snow cover posts here.

    Monday, November 28, 2011

    Winter '11 / '12 - Arctic Oscillation and Eurasia Snow Cover

    New research from Judah Cohen of sCast fame shows a strong correlation between the rate of change in Eurasia snow cover during October and the state of the Arctic Oscillation (AO) during the coming winter.

    The paper detailing the results of the study were published in the 05-NOV-11 issue of Geophysical Research Letters Vol 38.

    The "...develop(ment) a snow advance index (SAI) derived from antecedent observed snow cover...explains a large fraction of the variance of the winter AO."  The new index follows work relating monthly areal snow cover to NOAM temperatures and the implicit implication for the state of northern annular oscillation modes (AO / NAO).  The snow advance index (SAI) is the regression coefficient of the least square fit of the daily Eurasian SCE equatorward of 60°N calculated for the month of October.

    Note how the observed AO and surface temperature values for meteorological winter (D-J-F) are correlated in c) above.  The positive correlation in the eastern CONUS (red) means when the AO is positive...temperatures are warmer (positive anomalies) and vice versa.  When the AO is negative...temperatures are colder (negative anomalies).

    A strikingly similar depiction appears in d).  Cohen's new snow cover index derived in October is highly correlated (r = 0.86) with temperature anomalies in the eastern CONUS and all but mirrors the observed AO / T correlations during D-J-F.

    Cohen and Jones...
    "The implications of this discovery are potentially significant. Currently the AO is considered a product of the stochastic behavior of internal atmospheric dynamics and therefore chaotic.

    "The fact that we discovered a single predictive index that explains close to 75% of the variance of the winter AO (though the period is short and the degraded SAI over a longer time period explains less of the AO variance) is inconsistent with this thinking and demonstrates that the AO, while thought to be unpredictable, may in fact be one of the most easily predicted  phenomenon known in the climate system.  [emphasis added]

    "Even the most sophisticated GCMs achieve only marginal skill on the seasonal time scale in the extratropics. Implementation of the SAI in winter seasonal forecasts could potentially be a sea change in operational seasonal forecasts." 
    Full paper here (.pdf 920 kb).
    Harvey Leonard's (WCVB Boston) interviews with Dr. Cohen here and here.

    Wednesday, October 02, 2013

    Winter '13 / '14 - Eurasia Snowcover: September

    Rutgers' Global Snow Lab reports a dramatic increase in September/s areal snow cover over Eurasia.

    2,362,682 km^2
    7th highest overall
    49% above the period-of-record (1967 - 2013) normal of 1,587,905 km^2.
    120% above 2012.
    Largest areal coverage since 2001.

    ---
    Top chart:
    BLUE - areal snow cover in millions of km^2
    ORANGE - mean areal snow cover
    YELLOW - +/- 1 standard deviations
    RED - 9-point binomial filter


    Bottom chart:
    BLUE - period-of-record (1967 - 2013) median areal snow cover in millions of km^2
    RED - observed areal snow cover (2013)

    Rutgers data here.

    Saturday, December 08, 2012

    Winter '12 / '13 - Eurasia Snow Cover: November

    Actual:  22,031,257 km2
    Normal:  20,334,319 km2

    Eurasia/s November snow cover was one standard deviation (dashed yellow line) and 8% above normal.  Second year in a row November was above normal.


    Blue - observations
    Red - 9-point binomial filter
    Orange - median
    Dash yellow - one standard deviation

    ---
    Eurasian snow cover and departure from its median year-to-date.
    July/s snow cover was 84% below normal.


    October/s charts here.
    Raw data here.

    Friday, November 07, 2008

    Eurasia Snow Cover - OCT '08

    The sCAST forecast model from AER looks to October/s snow cover over Eurasia...Siberia in particular...as a leading indicator for winter temperature departures in the CONUS.

    OCT/s global snow cover climo from Rutgers U. 'Global Snow Lab' is shown on the left. What does OCT-08/s snowcover suggest about the coming winter?

    Good question.

    Even though mid-NOV is coming 'round the mountain...it/s apparently too early to tell b/c GSL has yet to post OCT/s numbers / analysis.

    We can; however...look @ the bellwether month/s starting point...which includes Week 1.

    September/s climo (L) and observed (R).
    Click images to enlarge
    A lot of ground to make up. Notice how little snow had accumulated over the Himalyan/s and more importantly...Siberia.

    Other NEWxSFC posts about sCAST here.

    Sunday, November 11, 2018

    Winter '18 / '19 - Eurasia Snow Cover: OCT

    Eurasia/s areal snow cover for OCT-18:  ~10,391,000 km2

    Last year:  ~12,052,000 km2

    1% above 53-year P-O-R-N (~10,260,000 km2)
    Rank: 22nd

    Lowest in eight years

    Seven of the last ten years above normal

    Analog years for winter '18 / '19
    Rank Winter ENSO
    1 82-83 W+
    2 00-01 C-
    3 69-70 W-
    4 01-02 nada-
    5 84-85 C

    ---
    Data courtesy Rutgers University Global Snow Lab
    http://climate.rutgers.edu/snowcover/index.php

    Thursday, November 07, 2019

    Winter '19 / '20 - Eurasia Snow Cover: OCT

    Eurasia/s areal snow cover for OCT-19: ~ 12,800,000 SQ-KM
    24% above 52-year P-O-R-N (~10,300,000 SQ-KM)
    27% above 52-year median (~10,100,000 SQ-KM)

    Rank: 7th
    3rd highest past 10 years
    4 of past 20 years below median ('05 ... '07 ... '08 ... '11)
    OCT-18:  ~10,400,000 SQ-KM
    OCT-19: 23% greater than OCT-18


    Ranked analog years 500 mb anomaly height composite for Winter '19 / '20
    ('15 / '16 ... '16 / '17 ... '09 / '10 ... '01 / '02 ... '14 / '15)

    - High 500 mb geopotential heights at hi-latitude ==> NAO & AO < 0
    - EPO > 0 ==> fast zonal flow over CONUS & mild PAC air masses
    -weak evidence of trof over coastal M-A & NE CONUS


    CORRECTION:  '15 / '16 & '09 / '10 ENSO should be 'W+'

    Key
    ENSO:  nada- (-0.5 < Region 3.4 SSTa <  0); C- (weak La Nina); W- (weak El Niño)
    NAO:  sign of D-J-F average
    AO:  sign of D-J-F average
    PDO:  sign of O-N-D-J-F-M average
    QBO:  + ==> west; - ==> east