Saturday, October 05, 2019

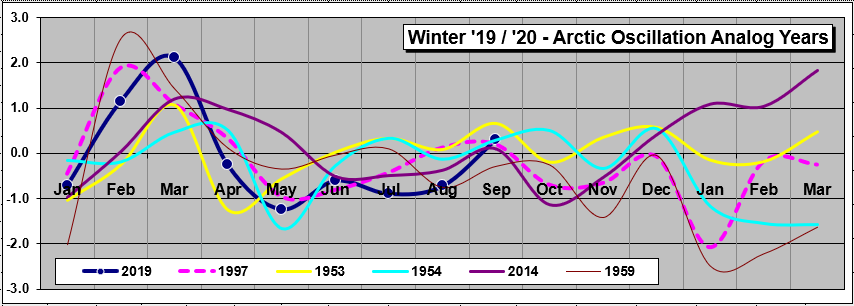
Winter '19 / '20 - Arctic Oscillation (AO): Leading Analogs' 500 mb Anomaly Height Composite ... as of SEP-19

Analog 5H composite ('53/'54 ... '54/'55 ...'59/'60 ... '97/'98 ... '14/'15) ... as of SEP-19

- Overall North American pattern mimics Tropic/Northern Hemisphere's (TNH) negative phase often associated with +ENSO.

- Positive height anomaly over eastern Canada displaces climatologically favored position of Hudson Bay trof limiting high-latitude cold air supply to the Lower 48.

- TNH associated with stronger than normal Pacific jet farther south of its normal axis and well above normal temperatures in eastern North America.


CORRECTION:  '53 / '54 ENSO should be 'W-'

KEY
ENSO:  nada- (-0.5 < SSTa <  0); C- (weak La Nina); W- (weak El Niño); W (moderate El Niño); W+ (strong El Niño)
NAO:  sign of D-J-F average
PDO:  sign of O-N-D-J-F-M average
QBO:  + ==> west; - ==> east; +/- flipped west to east

Thursday, October 03, 2019

Winter '19 / '20 - North Atlantic Oscillation (NAO): Leading Analogs' 500 mb Anomaly Height Composite... as of AUG-19

UPDATE:  SEP/s NAO did not change the analog years other than to shuffle the 4th and 5th ranks.

---
Analog 5H composite ('50/'51 ... '08/'09 ... '12/'13 ... '16/17 ... '17/'18) ... as of AUG-19


- Another round of Trof West - Ridge East

- EPO-like ridge offset slightly to the west of preferred position for a 'Trof-East' regime

- Azores HIGH suggests NAO > 0

- Negative height anomaly over south-central Canada favors primary storm track through the Upper Plains and across the Great Lakes in line with current soil moisture axis.


Winter '19 / '20 NAO analog analysis here.

Saturday, September 28, 2019

Winter '19 / '20 - Eurasian Snow Cover: AUG

Eurasia/s areal snow cover for AUG-19:  ~158,300 km2


-61% below 48-year P-O-R-N (~403,000 km2)
-46% below 48-year Median (~294,000 km2)
Rank: 39th

7th highest past 10 years
19 of past 20 years below median
 Last year:  ~140,800 km2

Analog years for winter '19 / '20
CORRECTION:  Second instance of 15/16 should be 16/17
---
Snow cover data courtesy Rutgers University Global Snow Lab
http://climate.rutgers.edu/snowcover/index.php

Thursday, September 26, 2019

Winter '19 / '20 - Arctic Oscillation (AO): AUG

AUG AO:  -.722
Leading analog contenders ... as of AUG-19.


Consensus Outlook:  Winter '19 / '20 AO < 0

KEY
ENSO:  nada- (-0.5 < SSTa <  0); C- (weak La Nina); W- (weak El Niño); W (moderate El Niño); W+ (strong El Niño)
NAO:  sign of D-J-F average
PDO:  sign of O-N-D-J-F-M average
QBO:  + ==> west; - ==> east; +/- flipped west to east

---
Present state
ENSO: 0 < ONI < 0.5 trending lower
NAO < 0 past 5 months
QBO > 0 past 10 months.  Peaked JUN-19; trending lower.  Possible flip during upcoming winter
PDO (MAR-18 to OCT-19) < 0 No trend.

Wednesday, September 25, 2019

Winter '19 / '20 - North Atlantic Oscillation (NAO): AUG

AUG NAO:  -1.17
Leading analog contenders ... as of AUG-19.

Consensus Outlook:  Winter '19 / '20 NAO > 0

CORRECTION:  '50 / '51 ENSO should be 'C-'

KEY
ENSO:  nada- (-0.5 < SSTa <  0); C- (weak La Nina); C (moderate La Nina)
AO:  sign of D-J-F average
PDO:  sign of O-N-D-J-F-M average
QBO:  + ==> west; - ==> east

---
Present state
ENSO: 0 < ONI < 0.5 trending lower
QBO > 0 past 10 months.  Peaked JUN-19; trending lower.  Possible flip during upcoming winter
PDO (MAR-18 to OCT-19) < 0 No trend.

Saturday, September 14, 2019

Winter '18 / '19 - North Atlantic Oscillation (NAO) Analog Verification

The analog forecasting technique seeks similarities to the NAO state in the run-up to the coming winter with NAO run-up states of winters past.  Presented here is the verification of NAO analogs for the '18 /'19 winter.

The NEWxSFC method ranks analog years by their the sum of square errors (SSE) statistic.
Lower SSE errors ==> stronger analog

Constraining the number of analog winters for analysis to five is arbitrary.

North Atlantic Oscillation (NAO) Index Analog Forecast Verification

In the run-up to Winter '18 / '19 ... '84 / '85 was the leading analog followed by '72 / '73 ... '59 / '60 ... '89 / '90 ... and '91 / '92.  Winter '18 / '19 NAO started weakly positive ... approached zero at meteorological winter's end ... then climbed above 1 in MAR.

A qualitative assessment of the analog forecast's accuracy would rate the analogs #2 or #5 as 'best' with #1 ... 3 ... and 4 'poor.'

A quantitative assessment of the other '72 / '73 and '91 / '92 teleconnections ... not so much.

Wednesday, August 21, 2019

Winter '18 / '19 - Arctic Oscillation (AO) Analog Verification

The analog forecasting technique seeks associations to the AO state in the run-up to the coming winter with AO run-up states of past winters.  Presented here is the verification of AO analogs for the '18 /'19 winter.

The NEWxSFC method ranks analog years by their the sum of square errors (SSE) statistic.
Lower SSE errors ==> stronger analog

Constraining the number of analog winters for analysis to five is arbitrary.

In the run-up to Winter '18 / '19 ... '55 / '56 was the leading analog followed by '64 / '65 ... '84 / '85 ... '99 / '00 ... and '91 / '92.  Observed AO values for Winter '18 / '19 began neutral in DEC ... turned weakly negative in JAN ... then surged positive at meteorological winter/s end and into MAR.

A qualitative assessment of the analog forecast/s accuracy rates '84 / '85 as best.

A quantitative assessment of the other '84 / '85 teleconnections ... not so much.

Wednesday, July 31, 2019

Winter '19 / '20 - NCDC Issues Updated Period-of Record Snowfall Climatology

Here


It's only been four years since the last update.

More NCDC climo data here

Tuesday, April 23, 2019

Winter '18 / '19 - 20th Annual 'Regular Season' Snowfall Forecast Contest: FINAL Results

After five snow storm forecasting contests ... under the ‘two-thirds’ rule … forecasters who entered at least FOUR forecasts are included in this season's FINAL standings.

Full table with all other error statistics at the Contest/s web site here (direct link).
Individual forecaster's storm statistics here (direct link).


Monday, April 08, 2019

Winter '18 / '19 - 18th Annual 'Season-total' Snowfall Forecast Contest: FINAL Results

UPDATE (08-APR-19)
Forecaster verification table at the Contest web site (direct link)
Season-total snowfall v period-or-record normal trend chart

---
Original post:  (07-APR-19 @ 8:30 PM EDT)

Congratulations to Donald Rosenfeld for his 1st Place finish.
Donald also placed first in '05 / '06 and '12 / '13.

Forecasters ranked by their total absolute error.


---

Season-total snowfall from all stations (784") came in 14% below the period-of-record normal (914").
Winter '18 / '19 ranks 11th among other Contest years since winter '04 / '05 ... the season when BGR and BGM were added to the station list.

---
Apologies for the abbreviated recap.
Will add to the pile a little at a time this week including each forecaster's station-by-station verification.