Friday, December 23, 2011
Thursday, December 22, 2011
Winter '11 / '12 - Sudden Stratospheric Warming Watch
A sudden stratospheric warming (SSW) event appears to be getting underway this week.
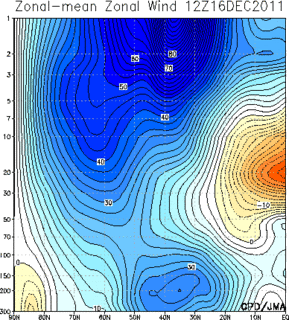
NWP output from the ECMWF continues to show an expectation for significant weakening of the stratosphere's polar vortex (PV) by year's end. The PV's west winds...having reached a maximum speed ~210 kts (110 m/s) a few days ago...are forecast to fall off a fookin'cliff and decrease to ~50 kts (25 m/s) by the end of the period. Diminishing PV wind speeds can lead to a reversal in flow where east winds become dominant. These are highly favorable conditions for a negative state of the Arctic Oscillation (AO) to develop if they persist and propagate into the troposphere.
"(a) rise in temperature of the stratosphere in the polar region in late winter resulting from enhanced propagation of energy from the troposphere by planetary-scale waves."
A major warming is defined as "...westerly winds at 60°N and 10 mb...become easterly [...]. A complete disruption of the polar vortex is observed and the vortex will either be split into daughter vortices, or displaced from its normal location over the pole."
A minor warming is defined as "...the westerly...winds are slowed; however... (they) do not reverse. [...] a breakdown of the vortex is never observed."
An alternate definition of a minor warming considers an observed temperature change of "...25°C...in a...week or less at any stratospheric level in any area of winter time hemisphere. The polar vortex is not broken down and the wind reversal from westerly...to easterly...is less extensive."
Wednesday, December 21, 2011
Winter '11 / '12 - 1st Quarter: Oh So Slow Start
![]() |
| E. 165th St - Bronx...NY 23-DEC-59 |
Slow starting seasons aren't at all common but they have happend.
The '06-'07 season didn't start until 12-FEB. Once the storms started rolling tho...they came somewhat fast and maybe a little furious with another one in late February... two during the 1st half of March...and one last pathetic gasp in mid-April.
Back then...a weak el Niño was fading...AO averaged 1.612...PDO averaged 0.06...and +QBO was well on its way to flipping to the east.
The only common factor between the two seasons was the persistently positive AO.
There are signs the AO may flip but that would be several weeks away.
Tuesday, December 20, 2011
Winter '11 / '12 - Arctic Oscillation - Day 20
This three day Height-Latitude Cross Section of Zonally Averaged Zonal Wind loop shows deep-layer easterly winds blowing over the pole...a weakening polar vortex (PV)...and a strengthening sub-tropical jet (STJ)...all of which are favorable ingredients for the Arctic Oscillation to finally go negative.
As a result...the AO has ducked below zero for the first time in what seems like ages.
| 12/18 | -0.024 |
| 12/19 | -0.882 |
| 12/20 | -0.438 |
Whether this trend continues remains to be seen.
Recent daily AO data here.
---
Contours show zonal wind speed with an interval of 2.5 m/s.
Easterly winds are shaded in warm colors.
Graphics courtesy the Japanese Meteorological Agency (JMA).
Saturday, December 17, 2011
Winter '11 / '12 - Arctic Oscillation - Day 15
The first sign points to a weakening polar vortex...
The wind speeds are currently running ~100 kt in the last few millibars @40°N and are forecast to weaken to ~45 kts at D+10. Also note the development of deep easterly flow below 100 mb suggesting the presence of a hi-latitude anticyclone and an strengthening sub-tropical jet. A hi-latitude HIGH would flip the sign of the AO to negative.
The second sign points to a warming stratosphere over 90°N...
If the warming persists and works its way down...this would build and anti-cyclone aloft which could propagate toward the surface and create of re-enforce a negative AO.
The last sign points toward a bloated chunk of cold air from Siberia migrating into eastern NOAM INVOF the Hudson Bay....
---
The state of the AO through the years (1950 - 2011) at fifteen days into the meteorological winter.
Certainly appears to have a degree of periodicity...especially the seven (yellow) and 11-year traces (red).
Sunday, December 11, 2011
Winter '11 / '12 - Arctic Oscillation - Near Record High - Part 2
Last Sunday...the Arctic Oscillation (AO) reached a near-record high of 5.647...or did it?
CPC has revised their data...without comment...for several days between 02-DEC and 08-DEC.
Old data...
12/2 2.928
12/3 4.830
12/4 5.647
12/5 4.850
12/6 4.762
12/7 4.674
12/8 4.586
New data...
12/2 2.051
12/3 4.394
12/4 3.443
12/5 3.424
12/6 3.954
12/7 3.075
12/8 1.653
Despite the change...the AO is still damn too high...altho the ECMWF has been signaling the past few runs this may be about to change...albeit not until early January...if the PV breaks in two and a sudden stratospheric warming event develops as suggested by yesterday/s 240hr 100mb prog and the split continues its upward propagation.
Thursday, December 08, 2011
Winter '11 / '12 - Early December Snow
Yesterday/s snowfall over portions of the forecast area came courtesy of a soggy nor'easter with frozen precipitation falling from the mid-level deformartion zone along the NW edge of the comma cloud shield.
These type of systems are rarely contest-worthy and this event was no exception. HPC/s 'Day 1' snow accumulation prog suggested a high decent probability for plowable snowfall along a narrow corridor threaded neatly in between the forecast stations.
HPC Winter Wx Forecasts
HPC Surface Analysis
NOHRSC Snow Analysis
GOES Image Search Engine
Wednesday, December 07, 2011
Winter '11 / '12 - White Christmas Probabilities
Updated below
White Christmas in the US is defined as 1" on-the-ground on 25-DEC. The criteria are different in other countries.
The probability of an event is determined by dividing the number of times something happened by the number of time it could have happened. If there was a white Christmas five times over 20 years...the probability is 25% in any given year.
This NCDC map is a little dated b/c it's based on the old 1961 - 1990 period of climate normals. Good enough for our purposes.
---
- A green Christmas; a white Easter.
- If there's thunder during Christmas week...
The Winter will be anything but meek.
- The nearer the New Moon to Christmas Day...the harder the Winter. [ed. - new moon is 24-DEC!]
- If Christmas day be bright and clear
There’ll be two winters in the year.
- Thunder in December presages fine weather.
[ed. - somewhat at odds with 'thunder during Christmas week]
- Like in December like all the year long.
[ed. - does this face forward or backward?]
UPDATE:
The NWS has updated their white Christmas probabilities map based on the current 30-year climo period between 1981 and 2010...
Tuesday, December 06, 2011
Winter '11 / '12 - Eurasia Snow Cover - November
The latest monthly data from the Rutgers Snow Lab shows the observed areal snow cover over Eurasia was more than one standard deviation above normal during November for the 2nd time in three years. It was the 5th highest coverage during the period of record (1966 - 2011).
Other Novembers where the snow cover was more than one standard devaition above the long term mean occured in 2009...1993...1973...1972...1970...and 1968.
Note the cluster of above normal Novembers between 1968 and 1973. What the 3 out of 4 years had in common were negative PDO...negative QBO...and negative NAO.
Areal snowfall data courtesy Rutgers Snow Lab.
Earlier post about Octobers' Eurasia snow cover here.
Sunday, December 04, 2011
Winter '11 / '12 - The North Atlantic Oscillation and Sea Surface Temperatures - Part 2
Today's AO reached the 2nd highest value since record keeping began in 1950. The NAO can be thought of as the eastern extension of the AO. These two indexes often rise and fall in tandem but not always.
Medium and short range forecasting of the NAO is difficult...at best. The correlation between NWP model forecasts and observed conditions at ranges of 10 and 14 days are currently 0.596 and 0.447...respectively. The forecasts are able to explain 36% and 20% of the NAO's variability. There's barely any skill at 10 days and none at 14 days.
This predictive limitation often leads to the conclusion the NAO cannot be reliably forecast beyond about seven days at best. The current seven-day correlation coefficient of 0.720 which means NWP explains 52% of the indice's variability.
There may be a predictive a relationship between sea surface temperature anomalies (SSTA) in the northern Atlantic in December and the state of the NAO...as shown below.
- Positive areas on the map indicate a positive correlation between SSTA and the NAO state. When SSTAs are positive (negative)...then NAO is positive (negative).
- Negative values on the map indicate a negative correlation between SSTA and the NAO state. When SSTAs are negative (positive)...then NAO is positive (negative).
For example...if above (below) normal SSTAs are observed along the west coast of Greenland in the Baffin Bay they are correlated with a negative (positive) NAO state .
The map shown below depicts SSTAs...as of 01-DEC-11.
Note the above normal SSTAs along the lower SW and SE coasts of Greenland and the negative SSTAs NE of the Azores. The correlation is negative along the Greenland coast and a positive NE of the Azores. These anomalies suggest favorable conditions for a negative NAO state.
Also note the above normal SSTAs along the NE CONUS coastline. These anomalies suggest favorable conditions for a positive NAO state.
There/s no clear signal about the future state of the NAO given the current SSTA observations; however...warmer than normal waters along coastal Greenland could contribute to ridge building should the long wave flow regime shift from its current configuration.
---
An earlier post explored the predictive relationship discoved by the UK MET Office between SSTAs observed in May and the state of the NAO during the following winter.


