Tuesday, November 21, 2017

Winter '17 / '18 - What about snow during La Niña winters?

From the ENSO blog at Climate.gov

"This La Niña footprint is pretty intuitive.

"Given the northward shift of the storm track, relatively cold and wet conditions are favored over the northern Rockies and northern Plains, resulting in the enhancement of snowfall.

"Warmer and drier winters are more likely during La Niña over more southern states, and this is exactly where seasonal snowfall tends to be reduced (4).

"The more vigorous storm track and slight tilt toward colder temperatures over the northern tier of U.S. during La Niña modestly increases the chance of a relatively snowy winter.

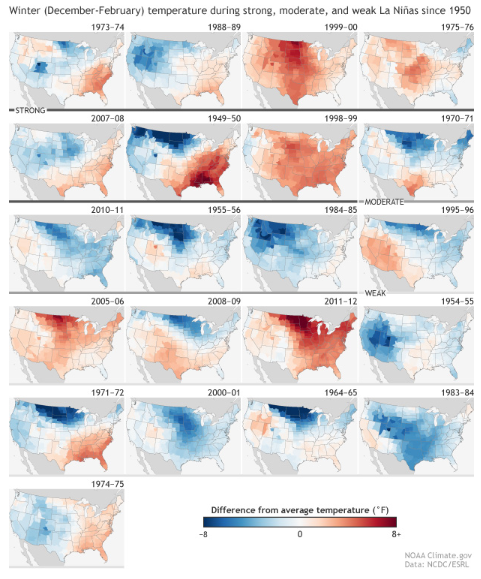
"We can break up the snow pattern further and look at the weakest and strongest La Niña events.  Splitting La Niña events into strength reveals some interesting differences worth investigating further.

"In this preliminary analysis below, there is a suggestion that weaker events are snowier over the Northeast and northern and central Plains on average."

More ...

---
NOTE:  the data period ends '09 / '10.  Since then ... there have been two El Ninos (one quite strong) ... two La Ninas ... and three cool La Nadas.

Saturday, November 18, 2017

Winter '17 / '18 - Arctic Oscillation Analog Years


To date ... 1973 is the leading analog year for the Arctic Oscillation (AO) in the run-up to the coming winter.

The average AO for Winter '17 / '18 would turn out negative should this come to pass.  The analog forecast has winter's AO/s minimum extent in FEB then continues its decline into meteorological spring and suggests a late-winter stratospheric warming event.

One problem.
Winter '73 / '74 ENSO/s signal was strong La Nina (-1.8°C temperature anomaly) yet a weak La Nina appears in the cards for this year and unlike this year ... the corresponding PDO analog year was negative (this year it's positive; trending negative) and QBO was west-positive (this year it's east-negative and trending same).

And herein lies the problem with analogs.
Analog years don't exist in a vacuum.
'08 / '09 weak La Nina; cool PDO trending warmer; QBO west [REJECTED]
'54 / '55 weak La Nina; cool PDO trending cooling; QBO east trending west [REJECTED]
'95 / '96  weak La Nina; warm PDO trending cooler; QBO west trending east [BEST MATCH]
'94 / '95 moderate El Nino; warm trending cooler;  QBO east trending west [REJECTED]

Other teleconnection indexes frequently confound the potential predictive value of a particular index.

---
Other correlation-type analysis techniques can also provide insight into the likely state of important winter teleconnection indexes.

Analysis of the Arctic Oscillation (AO) index's period-of-record reveals a statistically significant association (Chi-square Test for Independence; alpha = 0.05) between its sign for the month of NOV and the sign of the average AO index during a subsequent meteorological winter (D-J-F).

Period-of-record correlation analysis finds if NOV/s AO is negative (positive) ... then there's a 72% (52%) probability the winter's average AO/s sign will also be negative (positive).  The analysis false alarm rate is 28% (48%).

---
Historical note:  this is NEWxSFC web log's 1000th post!

Thursday, November 16, 2017

Winter '17 / '18 - Outlooks

Thread updated periodically as new outlooks and forecasts are issued from a variety of credible sources.
 
---
Judah Cohen (AER) via National Science Foundation
"The combination of cold and wet could result in an above normal snow season for parts of the northern U.S., including the large population centers of the northeastern U.S.
 
"... indicators suggest ... the polar vortex will break down later this winter, potentially unleashing an extended period of severe winter weather." (ED:  not necessarily over the Western Hemisphere)
 
 
---
  ---
Cohen (AER):  DCA 17"; BOS 64"; all large cities in the NE and M-A above normal
Bastardi (WxBell Analytics):  PHL 30"; DCA near normal
Crawford (Wx Co.):  DCA 17"
Rogers (Commodity Wx Group):  DCA below normal
Tolleris (WxRisk):  DCA near normal
Capital Wx Gang:  DCA 11"; IAD 16"; BWI 16"
Accu-Wx:  I-95 corridor near normal; NYC/BOS >=6" above normal
NECN:  New England near normal 
 

Wednesday, November 15, 2017

Winter '17 / '18 - NOV/s Arctic Oscillation: Winter/s Leading Indicator

The sign of NOV/s Arctic Oscillation (AO) index has a statistically significant (Chi-square Test for Independence; p <= 0.05) association with the sign of the average AO index during meteorological winter (D-J-F).

 AO Contingency Table
 p = 0.046 Nov + Nov - Total
 D-J-F + 16 10 26
 D-J-F - 15 26 41
 Total 31 36 67
 True + 52% 28% False -
 False - 48% 72% True +

'True + (-)' indicates a true (false) prediction.

IOW ... if NOV/s AO is negative ... then there's a 72% chance the winter's average AO/s sign will also be negative ...

...and the association between the AO/s negative sign for NOV and D-J-F has a 28% 'false alarm rate' (FAR).

The relationship is nowhere near as strong when NOV/s AO is positive (48% FAR).

---
Interesting ... albeit different ... relationship between NOV/s North Atlantic Oscillation (NAO).

Tuesday, November 07, 2017

Winter '17 / '18 - Eurasia Snow Cover - OCT

12,052,000 km2
18% above 52-year P-O-R-N (10,225,000 km2)

Rank: 11th
Lowest in five years

Eight of the last nine October above period-of-record-normal

Analog years for winter '17 / '18
Rank Winter ENSO
1 06-07 W-
2 69-70 W-
3 77-78 W-
4 00-01 C-
5 98-99 C+

---
Data courtesy Rutgers University Global Snow Lab
http://climate.rutgers.edu/snowcover/index.php

Sunday, November 05, 2017

Winter '17 / '18 - Eurasia Snow Cover - OCT - Snow Advance Index (SAI)

OCT-17's snow advance index is negative.
Snow Crow suicide watch now in effect.

---
AER reports a statistically significant correlation between their 'winter severity index' and how quickly Eurasian snow cover advances during OCT.

They define the 'winter severity index' by the state of the North Atlantic Oscillation / Arctic Oscillation (N/AO) and interpret it as an indicator of 'high latitude' blocking potential during D-J-F.

More blocking.
More winter.
More better.

Here's the model ...
"When snow cover advances rapidly (slowly) across Eurasia in October, this is an indication that the upcoming winter will be more severe (milder) for the Eastern US [sic], Europe and East Asia.


Study period seems surprisingly short seeing how contiguous monthly Eurasian snow cover data begins in 1970.  How well does the SAI correlate with the N/AO index prior to 1988?

---
Snow Advance Index (SAI) backgrounder from AER here.
Earlier Eurasia snow cover posts here.

Sunday, October 29, 2017

Winter '17 / '18 - Eurasia Snow Cover - OCT Preview

Cohen projecting above normal Eurasia snow cover for OCT ahead of an expected weak La Nina winter (D-J-F).

Nine previous weak La Nina winters ... including the famed 1995 - 1996 season ... have been observed during the Eurasia snow cover period of record (1967 - 2016). Only two NEWxSFC forecast stations -- BGM and ALB -- have a statistically significant correlation between season-total snowfall and above normal Eurasia snow cover.


Related:
Winter '17 / '18 - Correlation of Eurasia's OCT Snow Cover and Season-total Snowfall in NE and M-A Regions 

Winter '17 / '18 - First Contact

Post-frontal ... elevation snows INVOF UVM associated with SFC LOWs

Boone ... NC (3146' MSL)
KTNB 291615Z AUTO 30013G25KT 4SM -SN SCT008 BKN014 BKN020 02/01

Richlands ... VA (2653' MSL)
KJFZ 291555Z AUTO 32004KT 3SM -SN SCT004 BKN007 OVC014 00/00 A2972 RMK AO2 T00011001

Wise county ... VA (2684' MSL)
KLNP 291555Z AUTO 31004KT 1 1/2SM -SN OVC003 00/00

Hot Springs ... VA (3793' MSL)
KHSP 291555Z AUTO 29014KT M1/4SM -SN OVC003 02/02

Bluefield ... WV (2856' MSL)
KBLF 291552Z AUTO 31008KT 1 3/4SM -SN BR BKN006 OVC012 00/M01

Bedford county ... PA (1161' MSL)
KHMZ 291555Z AUTO 32006KT 5SM -SN OVC010 07/06

Thursday, October 26, 2017

Saturday, September 23, 2017

Winter '16 / '17 - Arctic Oscillation (AO) Analog Verification

The analog forecasting technique seeks similarities to the AO state during the multi-month run-up to the coming winter with same AO run-ups of winters past.

The NEWxSFC method ranks analog years by their the sum of square errors (SSE) statistic.
Lower SSE errors ==> stronger analog

Arctic Oscillation (AO) Index Analog Forecast Verification

In the run-up to Winter '16 / '17 ... the leading analog was '12 / '13 followed by '73 / '74 ... '02 / '03 ... '74 / '75 ... and '88 / '89.  A qualitative assessment of the forecast's accuracy would rate the top three analogs as 'poor' ... IOW ... useless.

Winter '12 / '13 NAO oscillated weak negative to strong negative; whereas ... Winter '16 / '17 was essentially a mirror opposite.  The closest analogs ... on the basis of the AO remaining positive throughout the three-month forecast period ... were ranked last ('88 / '89) and next to last ('75 / '76).

Conclusion:  The top three Winter '16 / '17 AO analogs showed little ... if any ... skill.

---
An alternative forecasting technique looks at the AO's sign for any calendar-year's month preceding the pending winter as a potential leading indicator of the AO's sign for D-J-F period.

Results from a chi-square 'test for independence' infers a statistically significant relationship ... at the 95% confidence level and a p-value < 0.05 ... between NOV's AO sign and AO's sign of the upcoming D-J-F period.  IOW ... if NOV's AO is negative (positive) ... then average AO state during the upcoming winter will also be negative (positive); although the classification model is stronger ... i.e., lower false alarm rate ... for the predictor's month with a negative sign than positive.

Conclusion:  If NOV's AO is negative ... chances are good the AO state will average negative during D-J-F period.

---
Period-of-record AO data here.