Showing posts sorted by date for query arctic oscillation. Sort by relevance Show all posts

Wednesday, October 26, 2022

Winter '22 / '23 - An over-the-horizon look at early autumn's a priori climate conditions

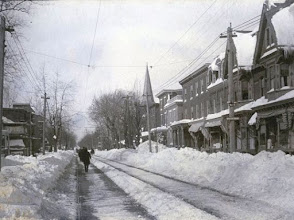
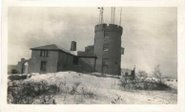
near Woodstock ... VT
Marion Post Wolcott (1940)
TL; DR
- The stars have yet to align for snow crows and other winter wx enthusiasts.
- Above-normal temperatures and below-normal snowfall for most NEWxSFC/s stations.
 
> Warranties neither expressed nor implied.
> User assumes all risk.
> Not intended for use by children.
 
---
Decoder Ring
AO: Arctic Oscillation
CONUS: Continental United States
D-J-F: December-January-February
ENSO: El Niño - Southern Oscillation
EPO: Eastern Pacific Oscillation
M-A: Mid-Atlantic
NE: New England
NAO: North Atlantic Oscillation
NHEMI: Northern Hemisphere
NWP: Numerical Weather Prediction
PDO: Pacific Decadal Oscillation
QBO: Quasi-Biennial Oscillation
PNA: Pacific-North American pattern
SSTa: Sea-Surface Temperature anomaly
SSW: Sudden Stratospheric Warming
 
---
To the extent ENSO ... QBO ... SSTa in the tropical Pacific and the NE coastal waters of CONUS ... sunspots ... PDO ... and the extent of Eurasian cover have any predictive value ... here laid upon the table is the current state of play heading into Winter '22 / '23 as divined from NEWxSFC/s Whirled Headquarters located east of the fall line in VA.

Friday, November 05, 2021

Winter '21 / '22 - Quasi-Biennial Oscillation (QBO): OCT-21

-19.14 (just inside 1-sigma from the mean)

OCT is now the 5th month with a QBO index below zero having flipped in JUN following its 14 month run in positive territory.  The 30mb flow over the Equator oscillates from east to west every 14 months; therefore ... the current easterly state of the QBO is expected to last throughout Winter '21 / '22.

Leading analog years
Winter / ENSO (MEI)
72-73 / W+
00-01 / C-
09-10 / W
91-92 / W+
58-59 / W-

With La Nina temperature anomalies in ENSO Region 3.4 expected to persist through at least late winter ... all QBO analog years are rejected except Winter 00/01.

- Winter '00 / '01
The sum-total of the season-total snowfall for all Contest forecast stations was 1,312".  (~21% above the 1968 - 2021 period-of-record average 1,085".

Eurasia/s OCT areal snow cover slightly below normal.

D-J-F Index Averages
AO:  -1.312
NAO:  +0.040

"The QBO determines the character of the early winter, leading to a colder and more stable polar vortex in December and January during the west phase of the QBO and a more disturbed and warmer Arctic during the east phase of the QBO." [1]

In years with low solar activity (solar cycle 25 is just beginning) ... the polar winter vortex tends to be disturbed and weak when the QBO is easterly.  Positive geopotential height anomalies over high latitudes ... i.e., blocking ... are also correlated with QBO-E and solar minimums.
 
Antecedent odds currently favor a weak and disturbed stratospheric polar vortex and SSW (sudden stratospheric warming) leading to a long-lasting negative Arctic Oscillation (AO) and well-below normal temperatures periodically in eastern North America ... northern Europe ... or eastern Asia.


Thursday, December 10, 2020

Winter '20 / '21 - North Atlantic Oscillation (NAO): Analog Composites of 500 mb Height and 2-meter Temperature Anomalies ... as of NOV-20

 NOV:  +2.54 🔥🔥🔥
Only two other NOVs had a higher index ('78 +3.04; '93 +2.56)

TL;DR  This winter/s average NAO index expected to be positive ( >0 ).

---
Analogs and weights for composites:

'03 / '04 (1)
'99 / '00 (1)
'91 / '92 (1)
'93 / '94 (1)
'15 / '16 (1)

Each analog's average NAO for D-J-F was > 0.

NAO/s analog winters are assessed against the upcoming winter/s expected states of:
- ENSO (MEI moderate - trending weak La Nina)
- QBO-W < 10
- PDO (cool)

We removed '03 / '04 ... '91 / '92 ... and '15 / '16 from further consideration b/c they were +ENSO winters.  Winter '93 / '94 had QBO-E so it too drops out.

Winter '99 / '00 survives with its weak La Nina --- QBO-W < 10 ... and a cool PDO.

Monday, November 09, 2020

Winter '20 / '21 - Arctic Oscillation (AO): Analog Composites of 500 mb Height and 2-meter Temperature Anomalies ... as of OCT-20

 Analog years and weights for composites:
'89 / '90 (3) ... '90 / '91 (2) ... '97 / '98 (2) ... '02 / '03 (1) ... and '15 / '16 (1).

Sadly ... all analog years were +ENSO winters; not something expected this season so they're of limited utility.

Arctic Oscillation (AO) analog composites of 500 mb (5H) geopotential height anomalies (GPHa) and 2-meter air temperature anomalies (2m Ta) for Winter '20 / '21.

5H GPHa weighted-composite

2m Ta weighted-composite

AO analog data table (unranked)
Analog statistic (not shown):  sum of squared errors


Wednesday, December 11, 2019

Winter '19 / '20 - Arctic Oscillation (AO): Leading Analogs' 5H and 2mT Composite Anomalies ... as of NOV-19

NOV-19 AO:  -1.193
Same analog years as those associated with AO/s OCT-19 analysis but with a shuffled ranking.

Winter / AVG AO
97-98 / -0.778
58-59 / -1.579
14-15 / 0.849
54-55 / -0.717
53-54 / 0.082
Weighted AO Analogs for Winter '19 / '20:  5H GPHa (l) & 2mTa (r)
- Negative 5H GPHa over Gulf of Alaska & Positive 5H GPHa INVOF Hawaii ==> EPO > 0
- Overall North American pattern mimics Tropic/Northern Hemisphere's (TNH) negative phase often associated with +ENSO.
- Negative TNH ==> 1)  stronger than normal Pacific jet farther south of its normal axis and 2) well above normal temperatures in eastern North America.
- Active sub-tropical jet
- Positive GPHa over eastern Canada would 1) advect cP flow from hi-latitude snow fields into the eastern U.S. and 2) weaken the Hudson LOW.

---
At the 95% confidence level ... the Chi-square 'Test of Independence' shows the negative state of NOV/s AO and the average AO state for the ensuing D-J-F period are not independent.  They are related and have predictive value.

Over the AO/s 69 year period-of-record ... the data show when NOV/s AO is negative ... there's a 71% chance the winter/s average AO will be also negative.

The present analog years add weight to the Chi-square analysis indicating AO/s average state this winter will be negative.

---
Key
5H - 500 mb
2mTa - 2 meter temperature anomaly
GPHa - geopotential height anomaly
EPO - Eastern Pacific oscillation
cP - continental Polar air mass
INVOF - in the vicinity of

Tuesday, December 10, 2019

Winter '19 / '20 - Leading Analog: Winter '04 / '05

Through a careful multi-variate analysis of key teleconnection indices and the process of elimination ... we/ve settled on the '04 / '05 winter as this winter/s leading analog for the Contest/s forecast area.

Bottom line up front:
- Temperature:  near normal except below normal over far northern stations
- Snowfall:
Above normal - northern half of forecast area
Normal to below normal - southern half of forecast area

--- 
Consensus of dynamic and statistical model outlooks
ENSO:  La Nada+ (0.5°C < ENSO Region 3.4 SSTa < 0.5°C)

Current PDO state (OCT-to-MAR) < 0

2019 trend analysis
QBO:  W (+) going E (-)

2x2 contingency table (Chi-SQ Test for Independence) AO NAO
If NOV AO < 0 then 71% probability D-J-F average AO < 0
If NOV NAO > 0 then 73% probability D-J-F average NAO > 0

The analog winter/s key features follow:
ENSO:  +0.5°C (lowest threshold of weak El Niño)
MEI:  La Nada+
QBO:  W (+) going E (-)
PDO < 0
AO < 0
NAO > 0
EPO < 0
Contest stations' cumulative season-total snowfall:  1,446" (AVG:  1,095")

Winter '04 / '05 - 5H GPHa (l) & 2mTa (r)
Negative 5H GPHa - W & Negative 5H GPHa - E  ==> Trof-W / Trof-E
Neutral 2mTa over east coast; negative 2mTa over New England

---
Winter '04 / '05 monthly anomalies (D-J-F)
 
DEC '04 - 5H GPHa (l) & 2mTa (r)
Positive 5H GPHa - W & Negative 5H GPHa - E  ==> Ridge-W / Trof-E
Negative 5H GPHa INVOF Greenland ==> NAO > 0
Positive 5H GPHa INVOF Gulf of Alaska & Positive 5H GPHa eastern ATL ocean ==> AO > 0
Positive 5H GPHa INVOF Gulf of Alaska & negative 5H GPHa INVOF Hawaii ==> EPO < 0
Negative 2mTa over SE and Gulf Coast


JAN '05 - 5H GPHa (l) & 2mTa (r)
Negative 5H GPHa - W & Positive 5H GPHa - E  ==> Trof-W / Ridge-E
Negative 5H GPHa INVOF Greenland ==> NAO > 0
Positive 5H GPHa INVOF Gulf of Alaska & Positive 5H GPHa eastern ATL ocean ==> AO > 0
Positive 5H GPHa INVOF Gulf of Alaska & negative 5H GPHa INVOF Hawaii ==> EPO < 0
Positive 2mTa over SE and Gulf Coast; negative 2mTa over NE CONUS

FEB '05 - 5H GPHa (l) & 2mTa (r)
Negative 5H GPHa - W & Negative 5H GPHa - E  ==> Trof-W / Trof-E
Positive 5H GPHa INVOF Greenland ==> NAO < 0
Negative 5H GPHa INVOF Gulf of Alaska & Negative 5H GPHa eastern ATL ocean ==> AO < 0

Neutral 2mTa over east coast; positive 2mTa over NE CONUS

---
Key
5H - 500 mb
2mT - 2 meter temperature
2mTa - 2 meter temperature anomaly
GPHa - geopotential height anomaly
ENSO - El Nino Southern Oscillation
MEI - Multivariate ENSO Index
AO - Arctic oscillation
NAO - North Atlantic oscillation
EPO - Eastern Pacific oscillation
PDO - Pacific Decadal oscillation
CONUS - continental United States
INVOF - in the vicinity of

Sunday, November 10, 2019

Winter '19 / '20 - Arctic Oscillation (AO): Leading Analogs' 500 mb Anomaly Height Composite ... as of OCT-19

Arctic Oscillation (AO) composites of 500 mb (5H) geopotential height anomalies (GPHa) and 2-meter air temperature anomalies (2m Ta) for analog winters '53 / '54 ... '54 / '55 ... '59 / '60 ... '97 / '98 ... '14 / '15.

5H GPHa composite

- Overall North American pattern mimics Tropic/Northern Hemisphere's (TNH) negative phase often associated with +ENSO.

- Negative TNH ==> 1)  stronger than normal Pacific jet farther south of its normal axis and 2) well above normal temperatures in eastern North America.

- Active sub-tropical jet

- Positive GPHa over eastern Canada would 1) advect cP flow from hi-latitude snow fields into the eastern U.S. and 2) effectively displace the Hudson LOW from its climatologically favored location.

5H GPHa weighted-composite

2m Ta weighted-composite

Friday, November 01, 2019

Winter '19 / '20 - Eurasia/s OCT Snow Advancement

 UPDATE (31-OCT-19)
Dr. Cohen via Tweeter ..."... the snow cover advance index came in at +0.6.

 "This does suggest a negative winter Arctic Oscillation and upcoming #PolarVortex disruption."


---
UPDATE (29-OCT-19)
Dr. Cohen via Tweeter ... "October SCE will likely be more than one standard deviation above normal.

"My research shows this favors colder winter temperatures across the N Hemisphere mid-latitudes including East US (sic)"

Saturday, October 05, 2019

Winter '19 / '20 - Arctic Oscillation (AO): Leading Analogs' 500 mb Anomaly Height Composite ... as of SEP-19

Analog 5H composite ('53/'54 ... '54/'55 ...'59/'60 ... '97/'98 ... '14/'15) ... as of SEP-19

- Overall North American pattern mimics Tropic/Northern Hemisphere's (TNH) negative phase often associated with +ENSO.

- Positive height anomaly over eastern Canada displaces climatologically favored position of Hudson Bay trof limiting high-latitude cold air supply to the Lower 48.

- TNH associated with stronger than normal Pacific jet farther south of its normal axis and well above normal temperatures in eastern North America.


CORRECTION:  '53 / '54 ENSO should be 'W-'

KEY
ENSO:  nada- (-0.5 < SSTa <  0); C- (weak La Nina); W- (weak El Niño); W (moderate El Niño); W+ (strong El Niño)
NAO:  sign of D-J-F average
PDO:  sign of O-N-D-J-F-M average
QBO:  + ==> west; - ==> east; +/- flipped west to east

Thursday, September 26, 2019

Winter '19 / '20 - Arctic Oscillation (AO): AUG

AUG AO:  -.722
Leading analog contenders ... as of AUG-19.


Consensus Outlook:  Winter '19 / '20 AO < 0

KEY
ENSO:  nada- (-0.5 < SSTa <  0); C- (weak La Nina); W- (weak El Niño); W (moderate El Niño); W+ (strong El Niño)
NAO:  sign of D-J-F average
PDO:  sign of O-N-D-J-F-M average
QBO:  + ==> west; - ==> east; +/- flipped west to east

---
Present state
ENSO: 0 < ONI < 0.5 trending lower
NAO < 0 past 5 months
QBO > 0 past 10 months.  Peaked JUN-19; trending lower.  Possible flip during upcoming winter
PDO (MAR-18 to OCT-19) < 0 No trend.

Wednesday, August 21, 2019

Winter '18 / '19 - Arctic Oscillation (AO) Analog Verification

The analog forecasting technique seeks associations to the AO state in the run-up to the coming winter with AO run-up states of past winters.  Presented here is the verification of AO analogs for the '18 /'19 winter.

The NEWxSFC method ranks analog years by their the sum of square errors (SSE) statistic.
Lower SSE errors ==> stronger analog

Constraining the number of analog winters for analysis to five is arbitrary.

In the run-up to Winter '18 / '19 ... '55 / '56 was the leading analog followed by '64 / '65 ... '84 / '85 ... '99 / '00 ... and '91 / '92.  Observed AO values for Winter '18 / '19 began neutral in DEC ... turned weakly negative in JAN ... then surged positive at meteorological winter/s end and into MAR.

A qualitative assessment of the analog forecast/s accuracy rates '84 / '85 as best.

A quantitative assessment of the other '84 / '85 teleconnections ... not so much.

Tuesday, January 29, 2019

Winter '18 / '19 - Snow Storm #3: The Forecasts!

Rookie  1
Intern  -
Journey  1
Senior  10
GOVT  1
PWSP  -
TOT  13

Welcome Rookie forecaster Hollowman501
Good Luck!

Forecaster table ranked ascending by storm-total precipitation (STP)
Correction:  The forecaster class for JessicaCain should be 'Journeyman.'

BLUE ==> 25th percentile.
RED ==> 75th percentile.
WHITE and GREY STP cells range between the 25th and 75th percentile.

Heaviest snowfall (+6") consensus along and to the right of CAR - BGR - CON - ALB - BTV - CAR.  Lollypop expected at CAR.

Arctic Oscillation (AO) lurking just beneath the surface.
North Atlantic Oscillation (NAO) floating high above the fray (again).
Pacific-North American (PNA) flattening out.

Everyone/s station-by-station forecast at the Contest/s web site.
Direct link to the forecasts table.

Sunday, January 20, 2019

Winter '18 / '19 - Snow Storm #2: The Forecasts

Rookie     1
Intern     1
Journey     -
Senior     11
GOVT     1
PWSP     1
TOT     15

Welcome Rookie forecaster chefjustin.
Good Luck!

Forecaster table (supposed to be) ranked ascending by storm-total precipitation (STP)*
* didn't come off the printer quite right


BLUE ==> 25th percentile.
RED ==> 75th percentile.
White and grey STP cells range between the 25th and 75th percentile.


Heaviest snowfall (+12") consensus along and the the right of CAR - BGR - PWM - CON - BGM - ALB - BTV - CAR.  Lollypop expected at BGR.


Arctic Oscillation (AO) coming up for air.
North Atlantic Oscillation (NAO) floating high above the fray (again).
Pacific-North American (PNA) bottoming out ... then arriving late to the party.

Everyone/s station-by-station forecast at the Contest/s web site.
Direct link to forecasts.

Wednesday, December 05, 2018

Winter '18 / '19 - November/s AO Predicts The State Of Winter/s AO

NOV/s Arctic Oscillation (AO) Index:  -1.116

Conventional meteorological wisdom holds the state of winter/s AO is next to impossible to forecast.

Some use analogs.  The analog forecasting methods seeks similarities between the AO state in the run-up to the coming winter with AO run-up states of winters past.  The NEWxSFC method ranks analog years by their sum of square errors (SSE) statistic.

Lower SSE errors ==> stronger analog

Constraining the number of analog winters for analysis to five is arbitrary.
See this year's analogs below.

---
An alternative forecasting technique looks at the AO/s 'sign' (i.e., positive or negative) for any calendar-year's month preceding the pending winter as a potential leading indicator of the AO/s sign for upcoming D-J-F period.

Results from a chi-square 'test for independence' infers a statistically significant relationship ... at the 95% confidence level and a p-value < 0.05 ... between NOV/s AO sign and AO/s sign of the upcoming D-J-F period.

IOW ... if NOV/s AO is negative (positive) ... then the average AO state during the upcoming winter will also be negative (positive); although the classification model is stronger ... i.e., lower false alarm rate ... for the predictor's month with negative signs than positive.

True + ==> prediction is True
False + ==> prediction is False


Given NOV-18/s negative AO ... the 2x2 contingency table predicts a 73% likelihood (27/37) the three-month average AO (D-J-F) will also be negative this winter.  The results says nothing about the magnitude of the winter/s AO or which months will be negative ... only the sign of its average.

During a +ENSO ... this bodes well for a colder than average winter over southern portions and snowier than average winter over just about everywhere across the NEWxSFC forecast area.

Sunday, November 25, 2018

Winter '18 / '19 - ENSO ... Arctic Oscillation ... & Season-total Snowfall @NEWxSFC Stations (Wonkish)

Roosting snow crows rooting for bonus snows thanks to expected weak-to-moderate El Niño conditions.

Typical analysis ignores influence of other controlling factors ... such as the Arctic Oscillation (AO).

BLUF:  ENSO state does not provide robust guidance for season-total snowfall (STP) outcomes @NEWxSFC stations unless AO is considered.

--- 
Analysis period:  '66 / '67 to '17 / '18 (D-J-F-M)
n = 52

For all winter ENSO states ... if AVG D-J-F-M AO < 0 … then STP @NEWxSFC stations > AVG
Weak correlation:  R = -0.311

Correlation (R) >= +/- 0.6 considered generally to have useful predictive power

ONI = Oceanic Niño Index

Thursday, October 04, 2018

Winter '17 / '18 - Arctic Oscillation (AO) Analog Verification

The analog forecasting technique seeks similarities to the AO state in the run-up to the coming winter with AO run-up states of winters past.  Presented here is the verification of AO analogs for the '17 /'18 winter.

The NEWxSFC method ranks analog years by their the sum of square errors (SSE) statistic.
Lower SSE errors ==> stronger analog

Constraining the number of analog winters for analysis to five is arbitrary.

Arctic Oscillation (AO) Index Analog Forecast Verification
In the run-up to Winter '17 / '18 ... '73 / '74 was the leading analog followed by '08 / '09 ... '54 / '55 ... '95 / '96 ... and '75 / '76.  Winter '17 / '18 AO started weakly negative and remained weakly negative until meteorological winter's end.  MAR-18 AO (not shown) crashed to -0.941.
 
A qualitative assessment of the forecast's accuracy would rate all analogs except '73 / '74 as 'poor' ... IOW ... useless.
 
OTOH ... analog #1 mimicked the observed behavior of the AO associated with a weak La Nina; whereas ... .  strong La Nina conditions prevailed during the winters of '73 / '74.
 
CONCLUSION:  The analog forecasting technique provided useful guidance for Winter '17 / '18.
 
---
An alternative forecasting technique looks at the AO/s 'sign' (i.e., positive or negative) for any calendar-year's month preceding the pending winter as a potential leading indicator of the AO's sign for upcoming D-J-F period.

Results from a chi-square 'test for independence' infers a statistically significant relationship ... at the 95% confidence level and a p-value < 0.05 ... between NOV's AO sign and AO's sign of the upcoming D-J-F period.

IOW ... if NOV's AO is negative (positive) ... then the average AO state during the upcoming winter will also be negative (positive); although the classification model is stronger ... i.e., lower false alarm rate ... for the predictor's month with negative signs than positive.  This is opposite of the relationship found for the NAO.


BOTTOM LINE:  If NOV's AO is negative ... chances are good the AO state will average negative during the D-J-F period.
 
NOV '17 AO/s sign was negative (-0.078).  The 2x2 contingency technique predicted correctly AO state for Winter '17 / '18 would average less than zero.  AO for the D-J-F period averaged (0-.076).

Saturday, September 29, 2018

Winter '17 / '18 - North Atlantic Oscillation (NAO) Analog Verification

The analog forecasting technique seeks similarities to the NAO state in the run-up to the coming winter with NAO run-up states of winters past.  Presented here is the verification of NAO analogs for the '17 /'18 winter.

The NEWxSFC method ranks analog years by their the sum of square errors (SSE) statistic.
Lower SSE errors ==> stronger analog

Constraining the number of analog winters for analysis to five is arbitrary.

North Atlantic Oscillation (NAO) Index Analog Forecast Verification
In the run-up to Winter '17 / '18 ... '90 / '91 was the leading analog followed by '94 / '95 ... '54 / '55 ... '04 / '05 ... and '02 / '03.  Winter '17 / '18 NAO started strongly positive ... strengthened through the heart of the season then crashed below zero following meteorological winter's end
 
A qualitative assessment of the forecast's accuracy would rate the analogs #2 ... #3 ... and #4 as 'poor' ... IOW ... useless.
 
OTOH ... analogs #1 and #5 mimicked the observed behavior of the NAO associated with a weak La Nina.  Moderate El Niño conditions prevailed during the winters of '94 / '95 and '02 / '03.
 
CONCLUSION:  The analog forecasting technique provided useful guidance for Winter '17 / '18.
  
---
An alternative forecasting technique looks at the NAO/s 'sign' (i.e., positive or negative) for any calendar-year's month preceding the pending winter as a potential leading indicator of the NAO's sign for upcoming D-J-F period.

Results from a chi-square 'test for independence' infers a statistically significant relationship ... at the 95% confidence level and a p-value < 0.05 ... between NOV's NAO sign and NAO's sign of the upcoming D-J-F period.

IOW ... if NOV's NAO is negative (positive) ... then the average NAO state during the upcoming winter will also be negative (positive); although the classification model is stronger ... i.e., lower false alarm rate ... for the predictor's month with positive signs than negative.  This is opposite of the relationship found for the Arctic Oscillation (AO).
 
BOTTOM LINE:  If NOV's NAO is positive ... chances are good the NAO state will average positive during the D-J-F period.
 
NOV '17 NAO/s sign was zero (0) for the 1st time in the index's 68 year record.  The 2x2 contingency technique offered no useful guidance.

Thursday, February 08, 2018

Winter '17 / '18 - Sudden Stratospheric Warming: Watch #1 - Update 1

Full reversal at D+5 (12-FEB) comports very well with the earlier D+10 forecast.
 
Full reversal continues at least through D+10.
Huge implications for the weather associated typically with a negative Arctic Oscillation toward month's end and into MAR.
 
 
Where the AO/s full impact is wrt arctic/s cold air drainage appears to be on the other side of the globe under the 'W' ; however ... note the NW flow regime and +PNA is progged over CONUS.

Saturday, February 03, 2018

Winter '17 / '18 - Sudden Stratospheric Warming: Watch #1

Something worth keeping an eye on ...

 
D+10/s polar vortex splits in two with action centers over northern Canada along ~90W and ~45E INVOF the Black Sea.
 
Deep layer ... high latitude flow reversal (negative / blue values into the board i.e., east wind / anticyclonic circulation) would provide highly favorable conditions for a negative Arctic Oscillation index over an extended period toward meteorological winter's end.

Thursday, December 07, 2017

Winter '17 / '18 - Arctic Oscillation - NOV

NOV/s Arctic Oscillation (AO) Index:  -0.078


Given NOV-17/s negative AO ... the 2x2 contingency table predicts a 72% likelihood the three-month average AO will be negative this winter.  The results says nothing about the magnitude of the winter/s AO or which months will be negative ... only its sign.

NOTE:
True + ==> correct prediction
False + ==> incorrect prediction


Scatterplot of the 67-year AO period of record (1950 - 2016)

Lower left quad:  NOV -AO and DJF -AO
Lower right quad:  NOV +AO and DJF -AO

Upper left quad:  NOV -AO and DJF +AO
Upper right quad:  NOV +AO and DJF +AO

Related posts by NEWxSFC ...
Winter '17 / '18 - NOV/s Arctic Oscillation: Winter/s Leading Indicator
http://newxsfc.blogspot.com/search?q=arctic+oscillation