Showing posts sorted by relevance for query arctic oscillation. Sort by date Show all posts

Thursday, December 07, 2017

Winter '17 / '18 - Arctic Oscillation - NOV

NOV/s Arctic Oscillation (AO) Index:  -0.078


Given NOV-17/s negative AO ... the 2x2 contingency table predicts a 72% likelihood the three-month average AO will be negative this winter.  The results says nothing about the magnitude of the winter/s AO or which months will be negative ... only its sign.

NOTE:
True + ==> correct prediction
False + ==> incorrect prediction


Scatterplot of the 67-year AO period of record (1950 - 2016)

Lower left quad:  NOV -AO and DJF -AO
Lower right quad:  NOV +AO and DJF -AO

Upper left quad:  NOV -AO and DJF +AO
Upper right quad:  NOV +AO and DJF +AO

Related posts by NEWxSFC ...
Winter '17 / '18 - NOV/s Arctic Oscillation: Winter/s Leading Indicator
http://newxsfc.blogspot.com/search?q=arctic+oscillation

Saturday, January 09, 2010

Winter '09 / '10 - Winter Temperatures and the Arctic Oscillation


From NASA/s Earth Observatory...


"This image illustrates how cold December was compared to the average of temperatures recorded in December between 2000 and 2008. Blue points to colder than average land surface temperatures, while red indicates warmer temperatures. Much of the Northern Hemisphere experienced cold land surface temperatures, but the Arctic was exceptionally warm. This weather pattern is a tale-tell sign of the Arctic Oscillation."
More...

The AO is a response to forcing...not a forcing in and of itself.

What caused the cold outbreak was a stratospheric warming event during late NOV / early DEC.  This caused the polar vortex to slow...split in two...and reverse direction...creating an anti-cyclonic (clock-wise) circulation aloft. The reversal took ~3 weeks to propagate to the surface...creating HIGH pressure over the pole....which in turn created favorable conditions for arctic outbreaks and high-latitude blocking...such as the one currently observed.

These reversal events occur preferentially during years (such as this one) where an east wind is observed in the tropical stratosphere...the quasi-biennial oscillation - QBO...and solar activity (sunspots) is low. Above normal snowfall in eastern Eurasia this fall played a significant role in initiating the stratospheric warming event.

HIGH pressure @high-latitudes is indicative of negative NAO and negative Arctic Oscillation (AO); however...to blame the cold on -NAO / -AO is just plain wrong.

Saturday, September 26, 2009

Winter '09 / '10 - Quasi-biennial Oscillation

The Quasi-biennial Oscillation (QBO) is characterized by alternating easterly and westerly descending wind regimes at the equator. It dominates the variability of the tropical stratosphere. Although the QBO is a tropical phenomenon...it affects the stratospheric flow from pole to pole by modulating the effects of extra-tropical waves. [M. P. Baldwin et.al., 2001 (.pdf)]

The period of oscillation varies between 20 and 36 months...with an average period of about 28 months...as measured over the past half-century. The QBO index at each stratospheric level is the zonally-averaged zonal (east-west) wind. It is the most predictable inter-annual climate fluctuation on the planet.


August QBO @30mb is -14.46 (data)...three months into its nascent easterly phase. It/s expected to remain easterly through spring 2010...reaching its peak amplitude (< -25) during the heart of meteorological winter.

QBO is important b/c it determines the character of the early winter. The east phase leads to a more disturbed and warmer Arctic in December and January. During winter...QBO appears to excite the 'northern annular mode' (aka Arctic Oscillation [Thompson and Wallace, 1998 (.pdf), 2000]. Its easterly phase is represented in composites geo-potential...wind...and temperature fields by a weaker polar vortex (PV)...warmer polar temperatures...and higher geo-potential heights at hi-latitudes. In years with low solar activity...the winter PV tends to be disturbed and weak when the QBO is easterly.

Monthly sunspot activity YTD (data) has been anomalously quiet (lowest 10th percentile) 24 of the past 32 months and every month since April 2008. Top-5 sunspot analog years: 1913...1823...1811...1810...1912.

Reconstructed NAO index (Li) for '12/'13 is 1.44 and '13/'14 is 1.63... neither of which lend any support to a correlation between weak PVs with its implied -AO/-NAO and extremely low sunspot activity.

Top-5 sunspot analogs for years beginning 1950 and their D-J-F AO/NAO: 2008 (0.259/-0.08)...1954 (-0.717/-0.76)...1996 (-0.096/-0.07)...1964 (-1.125/-0.61)...1976 (-2.617/-1.04) supports the correlation.

Polar temperature varies out of phase with sunspot activity (low sunspot activity ==> warmer temperature ==> higher geo-potential heights) for winters when the QBO is easterly. Weak...'warm' PVs are less able to contain arctic air masses at hi-latitudes than cold...strong...less disturbed PVs. This suggests potentially favorable conditions this winter for arctic outbreaks leading to strong baroclinic zones developing between land and water which represent prime conditions for cyclogenesis and block-buster Nor'easters.

Easterly QBO also favors the occurrence of major winter stratospheric warmings [Holton and Tan (1980)(.pdf)]. Stratosphere warmings propagate from 10mb to the surface in ~3 weeks. Should such a warming occur mid-winter during QBO minimum...it could very well signal a cold end to meteorological winter.
-----
Should QBO play a dominant role this winter...

  • Easterly phase during low solar activity ==> favors weak PV
  • Weak PV ==> high heights @ hi-latitudes
  • High heights @ hi-latitudes ==> negative northern annular modes (-AO / -NAO)
  • -AO / -NAO ==> arctic outbreaks + increased east coast snowfalls
  • Easterly phase favors major stratospheric warmings ==> lagged arctic outbreaks

QBO analogs YTD.

1991 is currently the leading analog. Winter '91 / '92 featured +ENSO (albeit one that became strong by spring)...+AO...+NAO...and -SOI...all of which go against type for -QBO. Did anonymously high (96th percentile) monthly sunspots play an active and deciding role?

EDIT: corrected sign of Winter '91 SOI.

Monday, December 27, 2010

Winter '10 / '11 - Arctic Oscillation

Beautiful imagery from NASA/s Earth Observatory showing surface air temperature anomalies resulting from persistently negative Arctic Oscillation.  Red (blue) areas are warm (cold) surface air temperature anomalies.  "This image shows the temperature of the land surface for December 3-10, 2010 compared to the average temperature for the same period between 2002 and 2009."

The monthly Arctic Oscillation index has been below zero...15 out of 18 months since JUN-09.  The AO fell to an all time low of -4.266 in FEB-10.  Last winter's D-J-F average was -2.587.

Persistent HIGH pressure...often associated with a weak polar vortex (PV)...over the north pole allows arctic air to drain into low latitudes.  Daily AO values have been negative since mid-NOV.  This goes against type considering the QBO is in its westerly phase where the AO is typically positive...a consequence of a strong...cold PV.


Friday, December 30, 2011

Winter '11 / '12 - Arctic Oscillation - Day 30

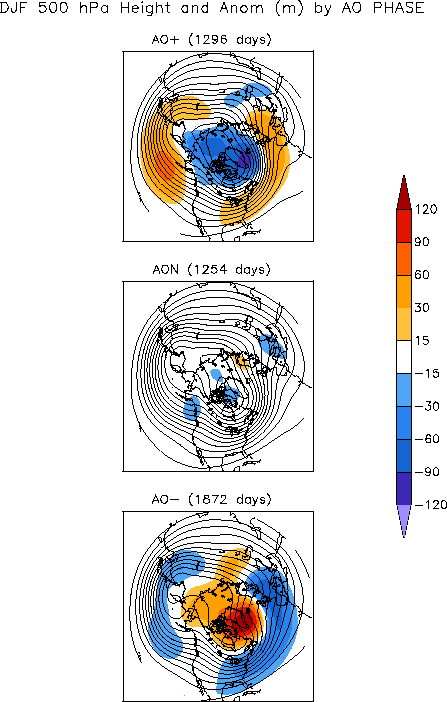
500 mb height anomalies
associated with
three states of the
Arctic Oscillation
Thirty days into the season...the Arctic Oscillation (AO) remains well above zero despite a weakening polar vortex (PV) and hi-latitude easterly winds.
The 500 mb height anomalies (below right) have looked more like the top chart which has kept arctic cold away from the mid-latitudes.  The ECMWF continues to depict a weak anti-cyclone building over the Pole; however the on-set is always at least seven days away. 

Today/s 500 mb height anomalies
The minor stratospheric warming event @10 mb has contributed to a weakened PV but is occurring well away from the pole INVOF northeast Asia and has not propagated below 30 mb.

Minor warmings do not cause the PV to break down or cause a wind reversal from west to east so it's debatable how much influence this event will have on establishing hi-latitude blocking.  Best guess:  very little.

---
Below is a time-series of the AO on 30-DEC throughout the 60+ year period of record (1950 - 2011).  The blue line is a trace of the daily AO index on 30-DEC.  The dark red line is a a trace of the same data after applying a nine-point binomial filter.  The filter removes low frequency noise and highlights decadal trends.


Not sure what this says about the AO at the end of December other than there is a decernable cycle every seven years or so.

Monday, October 05, 2009

Associations Between ENSO and AO in Winter

A moderately warm ENSO event seems to be a lock this winter. The multi-variate ENSO Index (MEI) is bullish as are a majority of numerical and statistical ENSO forecast models...even though the Southern Oscillation (data) hasn/t made up its mind.

Conventional wisdom suggests this scenario favors a split-flow regime with an active...moisture-laden sub-tropical jet (STJ) and opportune phasing with the polar jet (PJ) and producing strong cyclogenesis along the eastern seaboard. Add arctic HIGH pressure over eastern Canada and it/s snow-time.

The graphic below was extracted from NCEP/Climate Prediction Center/s ATLAS No. 8 - Relationships Between El Niño-Southern Oscillation and the Arctic Oscillation: A Climate-Weather Link

It shows composite fields for 500 mb geo-potential height...surface temperarture...and precipitation during +ENSO and three phases (positive...neutral...and negative) of the Arctic Oscillation (AO).

Best-case for snow crows during warm ENSO is a negative AO (bottom row of charts).

Otherwise...the mid-level long-wave trof axis is suppressed to the south...(neutral AO) or there/s no trof at all (+AO) and temperatures are above normal with the best moisture contained across the Deep South and the Mississippi and Tennessee River valleys.

Saturday, November 18, 2017

Winter '17 / '18 - Arctic Oscillation Analog Years


To date ... 1973 is the leading analog year for the Arctic Oscillation (AO) in the run-up to the coming winter.

The average AO for Winter '17 / '18 would turn out negative should this come to pass.  The analog forecast has winter's AO/s minimum extent in FEB then continues its decline into meteorological spring and suggests a late-winter stratospheric warming event.

One problem.
Winter '73 / '74 ENSO/s signal was strong La Nina (-1.8°C temperature anomaly) yet a weak La Nina appears in the cards for this year and unlike this year ... the corresponding PDO analog year was negative (this year it's positive; trending negative) and QBO was west-positive (this year it's east-negative and trending same).

And herein lies the problem with analogs.
Analog years don't exist in a vacuum.
'08 / '09 weak La Nina; cool PDO trending warmer; QBO west [REJECTED]
'54 / '55 weak La Nina; cool PDO trending cooling; QBO east trending west [REJECTED]
'95 / '96  weak La Nina; warm PDO trending cooler; QBO west trending east [BEST MATCH]
'94 / '95 moderate El Nino; warm trending cooler;  QBO east trending west [REJECTED]

Other teleconnection indexes frequently confound the potential predictive value of a particular index.

---
Other correlation-type analysis techniques can also provide insight into the likely state of important winter teleconnection indexes.

Analysis of the Arctic Oscillation (AO) index's period-of-record reveals a statistically significant association (Chi-square Test for Independence; alpha = 0.05) between its sign for the month of NOV and the sign of the average AO index during a subsequent meteorological winter (D-J-F).

Period-of-record correlation analysis finds if NOV/s AO is negative (positive) ... then there's a 72% (52%) probability the winter's average AO/s sign will also be negative (positive).  The analysis false alarm rate is 28% (48%).

---
Historical note:  this is NEWxSFC web log's 1000th post!

Tuesday, December 20, 2011

Winter '11 / '12 - Arctic Oscillation - Day 20

The persistantly positive state of the Arctic Oscillation (AO) may be starting to lean toward a long awaited change of sign.

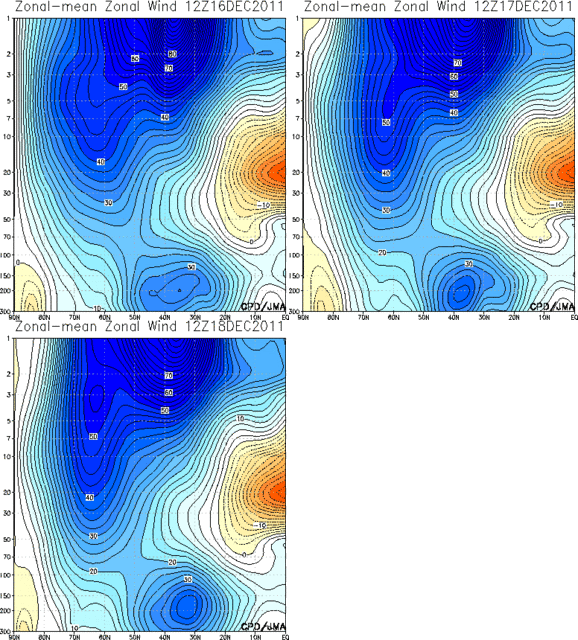
This three day Height-Latitude Cross Section of Zonally Averaged Zonal Wind loop shows deep-layer easterly winds blowing over the pole...a weakening polar vortex (PV)...and a strengthening sub-tropical jet (STJ)...all of which are favorable ingredients for the Arctic Oscillation to finally go negative.

As a result...the AO has ducked below zero for the first time in what seems like ages.

12/18-0.024
12/19-0.882
12/20-0.438

Whether this trend continues remains to be seen.
Recent daily AO data here.

---
Contours show zonal wind speed with an interval of 2.5 m/s.
Easterly winds are shaded in warm colors.
Graphics courtesy the Japanese Meteorological Agency (JMA).

Wednesday, November 22, 2017

Winter '17 / '18 - Fans of cold and snow in the U.S. will love this new winter outlook

Or so reads the headline from Mashable which comes with these nuggets of questionable conventional wisdom:

"Along the East Coast of the U.S., for example, major snowstorms tend to take place when a blocking pattern
is in place over Greenland." which more than explains why the AO index for 16 of the KU 66 storms rated '3' or higher was greater than zero including the Storm of the Century (1996).  The AO was positive for 42 storms in the landmark study.

The claim "When the Arctic Oscillation is negative, cold and snowy conditions are favored (though not guaranteed) in the eastern U.S." is unsupported by the data but why let pesky facts get in the way of a quality click-bait headline.


Don't know why the FB text field doesn't render.  Displays OK in Blogger's editor.
Here's the text ...

"Laying to rest the claim season-total snowfall in the NE and M-A is associated with winter's average Arctic Oscillation index.

"A mere 13% of the variability in NE and M-A season-total snowfall is explained by variability in the D-J-F average Arctic Oscillation."

---
What's not to love?

Sunday, January 07, 2007

Going Negative


To hear some people tell it...winter just ain/t winter unless there/s a lot of negativity going around. Negativity regarding certain teleconnection indexes...that is.

Take for instance the North Atlantic Oscillation. Conventional wisdom has it the NAO/s gotta be negative. The NAO/s at or above zero? Well then....winter just ain/t happenin' and ain/t gonna happen until it falls below zero.

Same 'thinking' goes for the Arctic Oscillation. AO/s gotta be negative. Can/t get good winter wx without a negative AO.

It/s not that a little negativity is necessarily a bad thing. Positive things can and do come from being negative...but does it have to be that way?

To test the hypothesis that good winter wx requires negative indices of the NAO and AO...30 NEWxSFC snowstorms since December 2002 were reviewed. The results shows there has been plenty of good winter wx when those indices were positive.

The 30 snowstorms used in the analysis are not necessarily representative of all snowstorms in the NE and M-A regions. Forecast contests have not been held for all snowstorms...mainly b/c the progs were not conclusive early enough to warrant a decision to hold a contest or the storm was not expected to produce more than nuisance amount or affect more than a few stations. Some storms in the analysis sample did not produce heavy snowfall.

The North Atlantic Oscillation
The NAO was negative for 16 storms (53%). Seven of those -NAO storms (44%) had a max station snowfall of at least 12". There was one storm where the max station snowfall was at least 20".

Of the 14 storms where the NAO was greater than or equal to zero...five (29%) had max station snowfall amounts of at least one foot. In fact...all five storms had least 20" and three storms had at least 25". Only one storm where max station snowfall was more than one foot had an AO below zero.


There/s a 53% chance that a Contest snowstorm will occur when the NAO is negative. When the NAO is negative...there/s a 23% chance of one station measuring at least one foot of snow and less than 1% chance of a measurement of at least 20".

There/s a 47% chance that a Contest snowstorm will occur when the NAO is positive. When the NAO is positive...there/s a 20% chance of at least one foot and an equal chance of at least 20".

Seems hard not to conclude that -NAO 1) isn/t necessary for Contest snowstorms and 2) isn/t the best for heavy snowfalls in the NE and M-A!

Tomorrow we/ll look at the Arctic Oscillation to evaluate how important it is for this teleconnection index to be negative if you/re looking for a good snowstorm.

Monday, November 28, 2011

Winter '11 / '12 - Arctic Oscillation and Eurasia Snow Cover

New research from Judah Cohen of sCast fame shows a strong correlation between the rate of change in Eurasia snow cover during October and the state of the Arctic Oscillation (AO) during the coming winter.

The paper detailing the results of the study were published in the 05-NOV-11 issue of Geophysical Research Letters Vol 38.

The "...develop(ment) a snow advance index (SAI) derived from antecedent observed snow cover...explains a large fraction of the variance of the winter AO."  The new index follows work relating monthly areal snow cover to NOAM temperatures and the implicit implication for the state of northern annular oscillation modes (AO / NAO).  The snow advance index (SAI) is the regression coefficient of the least square fit of the daily Eurasian SCE equatorward of 60°N calculated for the month of October.

Note how the observed AO and surface temperature values for meteorological winter (D-J-F) are correlated in c) above.  The positive correlation in the eastern CONUS (red) means when the AO is positive...temperatures are warmer (positive anomalies) and vice versa.  When the AO is negative...temperatures are colder (negative anomalies).

A strikingly similar depiction appears in d).  Cohen's new snow cover index derived in October is highly correlated (r = 0.86) with temperature anomalies in the eastern CONUS and all but mirrors the observed AO / T correlations during D-J-F.

Cohen and Jones...
"The implications of this discovery are potentially significant. Currently the AO is considered a product of the stochastic behavior of internal atmospheric dynamics and therefore chaotic.

"The fact that we discovered a single predictive index that explains close to 75% of the variance of the winter AO (though the period is short and the degraded SAI over a longer time period explains less of the AO variance) is inconsistent with this thinking and demonstrates that the AO, while thought to be unpredictable, may in fact be one of the most easily predicted  phenomenon known in the climate system.  [emphasis added]

"Even the most sophisticated GCMs achieve only marginal skill on the seasonal time scale in the extratropics. Implementation of the SAI in winter seasonal forecasts could potentially be a sea change in operational seasonal forecasts." 
Full paper here (.pdf 920 kb).
Harvey Leonard's (WCVB Boston) interviews with Dr. Cohen here and here.

Wednesday, November 15, 2017

Winter '17 / '18 - NOV/s Arctic Oscillation: Winter/s Leading Indicator

The sign of NOV/s Arctic Oscillation (AO) index has a statistically significant (Chi-square Test for Independence; p <= 0.05) association with the sign of the average AO index during meteorological winter (D-J-F).

 AO Contingency Table
 p = 0.046 Nov + Nov - Total
 D-J-F + 16 10 26
 D-J-F - 15 26 41
 Total 31 36 67
 True + 52% 28% False -
 False - 48% 72% True +

'True + (-)' indicates a true (false) prediction.

IOW ... if NOV/s AO is negative ... then there's a 72% chance the winter's average AO/s sign will also be negative ...

...and the association between the AO/s negative sign for NOV and D-J-F has a 28% 'false alarm rate' (FAR).

The relationship is nowhere near as strong when NOV/s AO is positive (48% FAR).

---
Interesting ... albeit different ... relationship between NOV/s North Atlantic Oscillation (NAO).

Monday, January 08, 2007

Going Negative - Part II


As winter approaches its midpoint next week...seasonable wx in the E has...by and large...been anything but seasonable. Save for a brief cold snap and a smattering of light snowfalls early on...winter/s wx has little to show for itself. El Nino/s been blamed for the current run of well-above normal mean monthly temperatures...as has the North Atlantic Oscillation. Some have even pointed an accusing finger or two at global warming.

Whatever the cause of this winter/s fitful start...hope for a full recovery during its second half is...in some quarters...heavily pinned on the getting the NAO and Arctic Oscillation (AO) teleconnections indexes below zero.

As yesterday/s analysis showed...good snowstorms have occurred in the NE and M-A when the NAO has been above zero. Most of the better storms happened when the NAO was not negative. The NAO and AO often oscillate in tandem...but not always.

When these indices are negative...cold wx does tend to dominant the eastern US but it also can work against snow b/c cold air is dry air.

The 30 snowstorms used in the analysis are not necessarily representative of all snowstorms in the NE and M-A regions. Forecast contests have not been held for all snowstorms...mainly b/c the progs were not conclusive early enough to warrant a decision to hold a contest or the storm was not expected to produce more than nuisance amount or affect more than a few stations. Some storms in the analysis sample did not produce heavy snowfall.

The Arctic Oscillation
The AO was negative for 17 storms (57%). Six of those storms (35%) had a max station snowfall of at least 12". Two of the storms had a max station snowfall of at least 20".

Of the 13 storms where the AO was greater than or equal to zero...five (38%) had max station snowfall amounts of at least one foot and four (31%) had at least 20". Only one storm where the max station snowfall was at least 12" had an NAO less than zero. Max station snowfall where the AO was greater than zero was 27.3"

There/s a 57% chance that a Contest snowstorm occurs when the AO is negative. When the AO is negative...there/s a 20% chance of one station measuring at least one foot of snow and a 7% chance of a measurement of at least 20".

There/s a 47% chance that a Contest snowstorm will occur when the AO is positive. When the AO is positive...there/s a 38% chance of at least one foot and an 8% chance of at least 20".

There/s a slightly better chance for a snowfall forecasting contest when the AO is negative than when the NAO is negative. Chances are about equal for a max station snowfall of at least 20" when the AO is either positive or negative; however...when the AO is positive...there/s a better chance of getting a max station snowfall of at least 12".

When the NAO and / or the AO are negative...winter air temperatures are characteristically cold; however...sometimes it/s too much of a good thing b/c cold air is dry air. Regardless of any particular indice/s sign...what/s needed for snow is cold air...moisture...and forcing to provide synoptic-scale upward vertical motion.

In tomorrow/s installment...we/ll look at another important winter teleconnection index -- the Pacific-North American -- to see what happens when it goes negative.

Wednesday, December 05, 2018

Winter '18 / '19 - November/s AO Predicts The State Of Winter/s AO

NOV/s Arctic Oscillation (AO) Index:  -1.116

Conventional meteorological wisdom holds the state of winter/s AO is next to impossible to forecast.
Some use analogs.  The analog forecasting methods seeks similarities between the AO state in the run-up to the coming winter with AO run-up states of winters past.  The NEWxSFC method ranks analog years by their sum of square errors (SSE) statistic.

Lower SSE errors ==> stronger analog

Constraining the number of analog winters for analysis to five is arbitrary.
See this year's analogs below.

---
An alternative forecasting technique looks at the AO/s 'sign' (i.e., positive or negative) for any calendar-year's month preceding the pending winter as a potential leading indicator of the AO/s sign for upcoming D-J-F period.

Results from a chi-square 'test for independence' infers a statistically significant relationship ... at the 95% confidence level and a p-value < 0.05 ... between NOV/s AO sign and AO/s sign of the upcoming D-J-F period.

IOW ... if NOV/s AO is negative (positive) ... then the average AO state during the upcoming winter will also be negative (positive); although the classification model is stronger ... i.e., lower false alarm rate ... for the predictor's month with negative signs than positive.

True + ==> prediction is True
False + ==> prediction is False


Given NOV-18/s negative AO ... the 2x2 contingency table predicts a 73% likelihood (27/37) the three-month average AO (D-J-F) will also be negative this winter.  The results says nothing about the magnitude of the winter/s AO or which months will be negative ... only the sign of its average.

During a +ENSO ... this bodes well for a colder than average winter over southern portions and snowier than average winter over just about everywhere across the NEWxSFC forecast area.

Wednesday, October 26, 2022

Winter '22 / '23 - An over-the-horizon look at early autumn's a priori climate conditions

near Woodstock ... VT
Marion Post Wolcott (1940)
TL; DR
- The stars have yet to align for snow crows and other winter wx enthusiasts.
- Above-normal temperatures and below-normal snowfall for most NEWxSFC/s stations.
 
> Warranties neither expressed nor implied.
> User assumes all risk.
> Not intended for use by children.
 
---
Decoder Ring
AO: Arctic Oscillation
CONUS: Continental United States
D-J-F: December-January-February
ENSO: El Niño - Southern Oscillation
EPO: Eastern Pacific Oscillation
M-A: Mid-Atlantic
NE: New England
NAO: North Atlantic Oscillation
NHEMI: Northern Hemisphere
NWP: Numerical Weather Prediction
PDO: Pacific Decadal Oscillation
QBO: Quasi-Biennial Oscillation
PNA: Pacific-North American pattern
SSTa: Sea-Surface Temperature anomaly
SSW: Sudden Stratospheric Warming
 
---
To the extent ENSO ... QBO ... SSTa in the tropical Pacific and the NE coastal waters of CONUS ... sunspots ... PDO ... and the extent of Eurasian cover have any predictive value ... here laid upon the table is the current state of play heading into Winter '22 / '23 as divined from NEWxSFC/s Whirled Headquarters located east of the fall line in VA.

Saturday, November 15, 2008

Arctic Oscillation - October '08

CPC posted OCT/s Arctic Oscillation (AO) index recently and it/s up...WAY-T-F up.

OCT came in @ a monster +1.676...the 1st positive value since MAR '08.

It/s only one data point but an important one b/c stratospheric and tropospheric circulations tend to be coupled during winter.

The AO tends to be in its negative phase (weak...warm vortex) when the QBO is negative (easterly). A -AO favors arctic outbreaks over the eastern CONUS; whereas...+AO and QBO-W are associated with a strong...cold PV.

+AO is famous for hording the coldest air over hi-latitudes.
No cold...arctic air => weak baroclinicity.
Weak baroclinicity => less cyclogenesis.
Less cyclogenesis => fewer storms.
Fewer storms => less chance of snow from migratory cyclones.

Time to fold up the tents and go home?

There/s no doubt QBO will be positive (westerly) for most of the '08 / '09 winter...until @ least late FEB / early MAR...which suggests D-J-F...as a whole...might not-be-so-cold-'n-wintry after all.

Best AO analog years using a 'least-squares' method: '95 /'96...'73 / '74...'54 / '55...'75 / '76...and '72 / '73.


R² value is down-right putrid (0.385) for 1st-choice analog year and they go down hill from there. None of the 'best' AO years match up well with 'best' QBO years...so there/s little-to-no confidence the AO analogs offer much insight this go 'round.

Tuesday, December 10, 2019

Winter '19 / '20 - Leading Analog: Winter '04 / '05

Through a careful multi-variate analysis of key teleconnection indices and the process of elimination ... we/ve settled on the '04 / '05 winter as this winter/s leading analog for the Contest/s forecast area.

Bottom line up front:
- Temperature:  near normal except below normal over far northern stations
- Snowfall:
Above normal - northern half of forecast area
Normal to below normal - southern half of forecast area

--- 
Consensus of dynamic and statistical model outlooks
ENSO:  La Nada+ (0.5°C < ENSO Region 3.4 SSTa < 0.5°C)

Current PDO state (OCT-to-MAR) < 0

2019 trend analysis
QBO:  W (+) going E (-)

2x2 contingency table (Chi-SQ Test for Independence) AO NAO
If NOV AO < 0 then 71% probability D-J-F average AO < 0
If NOV NAO > 0 then 73% probability D-J-F average NAO > 0

The analog winter/s key features follow:
ENSO:  +0.5°C (lowest threshold of weak El Niño)
MEI:  La Nada+
QBO:  W (+) going E (-)
PDO < 0
AO < 0
NAO > 0
EPO < 0
Contest stations' cumulative season-total snowfall:  1,446" (AVG:  1,095")

Winter '04 / '05 - 5H GPHa (l) & 2mTa (r)
Negative 5H GPHa - W & Negative 5H GPHa - E  ==> Trof-W / Trof-E
Neutral 2mTa over east coast; negative 2mTa over New England

---
Winter '04 / '05 monthly anomalies (D-J-F)
 
DEC '04 - 5H GPHa (l) & 2mTa (r)
Positive 5H GPHa - W & Negative 5H GPHa - E  ==> Ridge-W / Trof-E
Negative 5H GPHa INVOF Greenland ==> NAO > 0
Positive 5H GPHa INVOF Gulf of Alaska & Positive 5H GPHa eastern ATL ocean ==> AO > 0
Positive 5H GPHa INVOF Gulf of Alaska & negative 5H GPHa INVOF Hawaii ==> EPO < 0
Negative 2mTa over SE and Gulf Coast


JAN '05 - 5H GPHa (l) & 2mTa (r)
Negative 5H GPHa - W & Positive 5H GPHa - E  ==> Trof-W / Ridge-E
Negative 5H GPHa INVOF Greenland ==> NAO > 0
Positive 5H GPHa INVOF Gulf of Alaska & Positive 5H GPHa eastern ATL ocean ==> AO > 0
Positive 5H GPHa INVOF Gulf of Alaska & negative 5H GPHa INVOF Hawaii ==> EPO < 0
Positive 2mTa over SE and Gulf Coast; negative 2mTa over NE CONUS

FEB '05 - 5H GPHa (l) & 2mTa (r)
Negative 5H GPHa - W & Negative 5H GPHa - E  ==> Trof-W / Trof-E
Positive 5H GPHa INVOF Greenland ==> NAO < 0
Negative 5H GPHa INVOF Gulf of Alaska & Negative 5H GPHa eastern ATL ocean ==> AO < 0

Neutral 2mTa over east coast; positive 2mTa over NE CONUS

---
Key
5H - 500 mb
2mT - 2 meter temperature
2mTa - 2 meter temperature anomaly
GPHa - geopotential height anomaly
ENSO - El Nino Southern Oscillation
MEI - Multivariate ENSO Index
AO - Arctic oscillation
NAO - North Atlantic oscillation
EPO - Eastern Pacific oscillation
PDO - Pacific Decadal oscillation
CONUS - continental United States
INVOF - in the vicinity of

Tuesday, December 22, 2009

Winter '09 / '10 - Arctic Oscillation


The Arctic Oscillation (AO) was headed toward near-record levels during the past weekend while an historic storm buried many locations in the mid-Atlantic and southern New England with record snowfalls. 

A minor stratospheric warming event preceded the east coast snow storm by three-to-four weeks. The polar vortex (PV) weakened after splitting in two during late NOV and early DEC...as reported on the NEWxSFC web log here...here...and here.

The PV/s stronger half shifted from the eHEMI to wHEMI...where opposing flow between the two circulations created weak ridging near the pole.  With time...the ridging aloft made its way to the surface where an arctic anti-cyclone pushed the AO to levels seldom seen.

The last time the AO was less than or equal to 21-DEC-09/s -5.668 value was over 20 years ago on 01-JAN-85.

The AO has been this low...or lower...on just 15 days since modern record-keeping began in 1950  (NOV-59, JUN-64, JUL-64, MAR-70, JAN-77, JAN-85).  The odds of an AO index value at or below -5.668 are 1 in 1460 (0.07%).

The record negative value of -7.433 was set 15-JAN-77 during a borderline +ENSO (MEI = 0.484)... strong +PDO (1.65)...and an east QBO (-14.91).


Saturday, December 03, 2011

Winter '11 / '12 - Arctic Oscillation - Day One

The Arctic Oscillation (AO) index continues to stick its thumb in the eye of east coast winter weather enthusiasts by climbing to more than three standard deviations above 'normal' in its 7-day moving average.

Today...on the 1st day of meteorological winter...the AO/s daily value stands at 4.830!

There are 19 other days during the AO/s period-of-record beginning in 1950 where the index has been at least as high.


Hyper-AO appears to favor weakly positive ENSO and weakly negative PDO.  QBO swings both ways although there is some preference to its negative state.  No apparent association with this year's conditions b/c ENSO is moderately negative.

Just out of idle curiosity...various length running means of the AO index for the first day of meteorological winter (D-J-F) is shown below.
 

Not sure what...if anything...this reveals about the AO other than the first day of winter...during the '90s...the northern annular mode was generally above zero and during all other periods...it was generally below zero.  The '90s were a time of numerous el Niños and a PDO in its positive phase. (corrected chart 12/10).

There is no indication in the latest 10-day forecasts for the polar vortex at 10 mb to weaken (west winds observed currently +170 kts INVOF AK) or the development of hi-latitude blocking.  In fact...today/s ECMWF 10 mb forecast has the PV wind speed increasing to 220 kts by D+10.

Tuesday, January 03, 2012

Winter '11 / '12 - Arctic Oscillation and Chi Square

Geo. Washington...Valley Forge...PA (1928)
Wes Junker...of the WaPo/s Capital Weather Gang blog...crafted an interesting post last month about January/s temperature and precipitation prospects.  He included a rough analysis on the likelihood of December/s persistently positive Arctic Oscillation (AO) carrying over through January.  The article concluded the chances were high for such an outcome.

One measure of whether two events -- such as the AO for two months -- are independent of each other or whether a strong association exists between them is the chi-square test.  The distribution of observed events (positive one month, negative the next or vice-versa) is compared to the distribution of the 'expected' events.  Small differences between the 'observed' and 'expected' are interpreted as evidence of an association.  Large differences mean they are independent.

No statistical testing was presented in Junker/s post; however...strong evidence for an association does exist...as shown in the table below at the intersection of DEC and JAN.  The probability is 0...to three decimal places...the association between  December/s and January/s AO state occurs by chance.

---
What about the other 'cool season' months?  Can more predictive information be mined from these data?  Is there a statistically significant association between the AO state lurking elsewhere?

Monthly AO data between 1950 and 2010 from CPC were analyzed using the 'chi-square' statistic to determine if there were statistically significant associations between months.

There is a fairly strong association between SEP/s AO state and that of FEB (a 5.5% probability the association occurs by chance) and a good association between JAN and FEB (8% probability)

What does AO state for SEP-11 'predict' for FEB-12?  The SEP-11 AO was 0.665...so FEB-12 'should' follow suit and be positive.

What does AO state for JAN-12 'predict' for FEB-12?  The JAN-12 AO is unknown but since JAN follows DEC....JAN-12 AO 'should' also follow suit...which implies FEB-12 will be positive.

Winter's where the AO ran hot between DEC and FEB have occurred nine times since 1950 (1972/3...1974/5...1975/6...1988/9...1991/2...1992/3...1998/9...1999/00...2007/08).

Not lookin'good for the home-team...altho all may not be lost this winter.

The so called 'Storm of the Century' roared out of the GOM and tore up the east coast in MAR-93 after +AO in D-J-F (1.627; 3.495; 0.184) and MAR was 0.764!  There was a 'notable' NESIS storm in MAR-99 and the unforgettably infamous JAN-00 storm.